


26, Oct 2026
Abu Dhabi Invests In The Next Generation Of Musical Talent With A New Dedicated Institution For The Youth Orchestra Abu Dhabi
A long-term pathway for young musicians through free access to world-class music education.
ABU DHABI, UAE, Oct. 26, 2026 /PRNewswire/ — The Department of Culture and Tourism – Abu Dhabi (DCT Abu Dhabi) is proud to announce the establishment of a dedicated institution for the Youth Orchestra Abu Dhabi. The institution will form an integral part of Abu Dhabi’s music and performing arts landscape, advancing the emirate’s cultural vision to widen access to artistic excellence and build a vibrant cultural ecosystem for the future. It will provide free access to world-class music education programmes for aspiring young musicians.

Set to open in January 2027 in the Mina Zayed (MiZa) district, Youth Orchestra Abu Dhabi’s 600-seat concert hall and 18 rehearsal and practice rooms will provide a professional-standard environment for collective music-making. Enrollment for the first cohort of 100 students aged 6–9 is now open. Over the coming years, the programme will nurture young musicians through training in both Western classical and Arabic musical traditions. Additional ensembles for advanced students will be introduced during the first year of the programme.
The programme will establish long-term pathways for young people across the emirate to engage with music, develop their skills and progress over time.
His Excellency Mohamed Khalifa Al Mubarak, Chairman of DCT Abu Dhabi, said: “The Youth Orchestra Abu Dhabi is an important investment in our future and in our commitment to making culture and creativity accessible to all. Through its free-access to world-class music education programmes, we are creating opportunities for young people to discover their talent, develop their potential and experience the lifelong benefits that music can bring. Beyond technical ability, music fosters discipline, collaboration, creativity and confidence, qualities that shape well-rounded individuals, enrich communities and contribute to a more vibrant society.
“The Youth Orchestra Abu Dhabi will become both a platform for emerging talent and a cornerstone of the emirate’s growing cultural ecosystem. As Abu Dhabi continues to strengthen its position as a global centre for culture and creativity, and as a UNESCO Creative City of Music, institutions such as this ensure the next generation has every opportunity to participate in, contribute to and shape our cultural future, while preserving the rich musical traditions that form an important part of our heritage.”
The building has been designed by the late Frank Gehry, a pioneering figure in contemporary architecture and the architect of the recently announced performing arts institution Dar al Funoon Abu Dhabi. His architectural contributions to Abu Dhabi also include the design of the upcoming Guggenheim Abu Dhabi in Saadiyat Cultural District.
Youth Orchestra Abu Dhabi reflects the emirate’s continued investment in creative talent, cultural participation and the performing arts, supporting personal development and fostering community connection through creative expression.
ABOUT DEPARTMENT OF CULTURE AND TOURISM – ABU DHABI
The Department of Culture and Tourism – Abu Dhabi drives the sustainable growth of Abu Dhabi’s culture and tourism sectors, fuels economic progress and helps achieve Abu Dhabi’s wider global ambitions. By working in partnership with the organisations that define the Emirate’s position as a leading international destination, Department of Culture and Tourism – Abu Dhabi strives to unite the ecosystem around a shared vision of the Emirate’s potential, coordinate effort and investment, deliver innovative solutions, and use the best tools, policies and systems to support the culture and tourism industries.
Department of Culture and Tourism – Abu Dhabi’s vision is defined by the Emirate’s people, heritage and landscape. We work to enhance Abu Dhabi’s status as a place of authenticity, innovation, and unparalleled experiences, represented by its living traditions of hospitality, pioneering initiatives and creative thought.
For more information about the Department of Culture and Tourism – Abu Dhabi and the destination, please visit: dctabudhabi.ae and visitabudhabi.ae and abudhabiculture.ae


 View original content to download multimedia:https://www.prnewswire.co.uk/news-releases/abu-dhabi-invests-in-the-next-generation-of-musical-talent-with-a-new-dedicated-institution-for-the-youth-orchestra-abu-dhabi-302919175.html

- 0
- By Sai Krishna

26, Oct 2026
Zimmer Biomet India Launches ROSA® Knee with OptimiZe™ in India to Advance Personalized Robotic-Assisted Knee Replacement
NEW DELHI, Oct. 26, 2026 /PRNewswire/ — Zimmer Biomet Holdings, Inc. (NYSE: ZBH) and (SIX: ZBH), a global medical technology leader, today announced the launch of ROSA® Knee with OptimiZe™ in India, an enhanced version of its ROSA® Knee System designed to support personalized robotic-assisted total knee replacement surgery. The technology combines customized surgical planning with new positioning, tracking and alignment features to help support accuracy and reduce user variability.
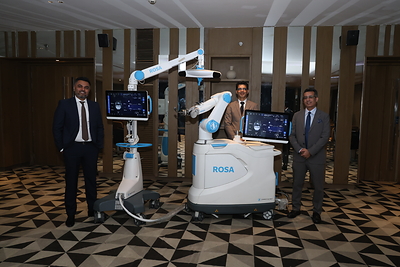
ROSA® Knee with OptimiZe™ features enhancements designed to support a more personalized surgical experience:
- OptimiZe Planning™: Creates customized surgical plans to guide implant positioning based on individual patient anatomy and the surgeon’s knee-balancing preferences.
- OptimiZe Landmarking™: Uses a bone-painting feature to help reduce user landmarking variability.
- OptimiZe Tracking™: Uses motion-sensitive Active Track™ technology to eliminate the need to pin the Cut Guide to the bone, allowing bone resections to remain on plane even with leg movement.
Commenting on the launch, Ajay Bagga, Managing Director and Country Head, Zimmer India Pvt. Ltd, said, “Orthopaedic care is moving towards more personalized approaches, with technology creating new opportunities to support surgical decision-making and address individual patient needs. Our focus is on bringing technologies to India that support surgeons in tailoring care to individual patients. The launch of ROSA® Knee with OptimiZe™ reflects our continued commitment to advancing robotic-assisted surgery, with tools designed to support greater consistency in surgical planning and execution.”
ROSA® Knee with OptimiZe™ also integrates with ZBEdge® Analytics, Zimmer Biomet’s data analytics platform, to provide surgeons with data-driven insights to support informed clinical decision-making.
The India launch builds on Zimmer Biomet’s continued investment in robotic-assisted technologies designed to support surgeons’ individual approaches to knee replacement surgery.
About Zimmer Biomet
Zimmer Biomet is a global medical technology leader with a comprehensive portfolio designed to maximize mobility and improve health. We seamlessly transform the patient’s experience through our innovative products and suite of integrated digital and robotic technologies that uncover insights from data, enabling surgeons to assess clinical decisions on patient recovery. In India, Zimmer Biomet’s presence also includes its Global Capability Center (GCC), reflecting the company’s continued commitment to the country. With 99 years of trusted leadership and proven expertise, Zimmer Biomet is positioned to deliver the highest quality solutions to patients and providers. Our legacy continues to come to life today through our progressive culture of evolution and innovation.
For more information about our product portfolio or about joining our team, visit http://www.zimmerbiomet.com or follow Zimmer Biomet on www.twitter.com/zimmerbiomet.
 View original content to download multimedia:https://www.prnewswire.com/in/news-releases/zimmer-biomet-india-launches-rosa-knee-with-optimize-in-india-to-advance-personalized-robotic-assisted-knee-replacement-302919104.html

26, Oct 2026
AUTOCRYPT Highlights V2X Security Technologies and C-ITS Research Initiatives at ITS World Congress 2026
SEOUL, South Korea, Oct. 26, 2026 /PRNewswire/ — AUTOCRYPT, a leading Physical AI security solutions provider, showcased its comprehensive Vehicle-to-Everything (V2X) security solutions, automotive cybersecurity testing technologies, and national Cooperative Intelligent Transportation Systems (C-ITS) research initiatives at ITS World Congress 2026, held from October 19-23 at Gangneung Olympic Park in South Korea.

As one of the world’s largest gatherings dedicated to Intelligent Transport Systems (ITS), ITS World Congress brings together global mobility leaders, transportation authorities, and industry experts. With the 2026 event hosted in South Korea, AUTOCRYPT highlighted its nationwide C-ITS security deployments across 10 locations spanning over 5,000 kilometers. These efforts include regional demonstration initiatives leveraging AutoCrypt PKI-PnC technology to enable secure authentication between electric vehicles and charging infrastructure, including a representative project in the Jeonnam-Gwangju region.
Beyond the exhibition, AUTOCRYPT representatives shared industry insights across three technical and strategic conference sessions addressing privacy-preserving V2X tolling, secure vehicle-infrastructure data exchange, and compliance with global automotive cybersecurity regulations and standards. These discussions reflected AUTOCRYPT’s continued commitment to industry collaboration in advancing secure and interoperable intelligent transportation systems.
“Securing the future of connected mobility requires robust infrastructure, practical validation, and close collaboration among stakeholders across the mobility ecosystem,” said Duksoo Kim, CEO of AUTOCRYPT. “Through our experience in national C-ITS projects and continued engagement with global industry partners, we aim to strengthen the cybersecurity foundations that support future transportation networks.”
AUTOCRYPT continues to advance its integrated cybersecurity solutions through real-world applications, ongoing research, and collaboration with industry organizations, extending its security expertise across the broader Physical AI ecosystem.
To learn more, visit autocrypt.io.
About AUTOCRYPT
AUTOCRYPT is a leading provider of Physical AI security solutions protecting autonomous and connected vehicles, EV charging infrastructure, robotics, defense, and bio-healthcare systems. Built on expertise in automotive cybersecurity engineering, penetration testing, security validation, and consulting, AUTOCRYPT delivers end-to-end cybersecurity throughout the system lifecycle. As the only designated automotive cybersecurity Technical Service (TS) provider in the Asia-Pacific region, the company supports OEMs and suppliers from development through post-production while enabling compliance with global standards. AUTOCRYPT is extending trusted security across vehicles, communications, and connected services to help shape the future of Physical AI security.
 View original content to download multimedia:https://www.prnewswire.co.uk/news-releases/autocrypt-highlights-v2x-security-technologies-and-c-its-research-initiatives-at-its-world-congress-2026-302917791.html

26, Oct 2026
Tin Men Capital leads US$7.4M Series A for Vision AI startup Ailytics to expand across APAC, US and Gulf
SINGAPORE, Oct. 26, 2026 /PRNewswire/ — Ailytics, a vision AI startup that turns existing industrial CCTV into a real-time safety and operations layer, has raised US$7.4 million in a Series A led by Tin Men Capital. SEEDS, part of SG Growth Capital, Safie, Japan’s largest cloud camera company, and one of Japan’s largest construction companies joined family offices and existing investors.
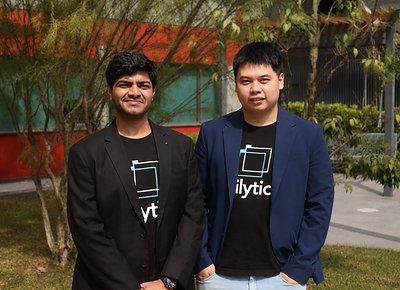
Since a US$2.7 million pre-Series A led by Tin Men Capital in April 2024, Ailytics has grown from 70 projects in four countries to more than 400 deployments across 15 countries.
From Singapore to four continents
Ailytics began on Singapore public housing (HDB) projects and now runs large deployments at NatSteel, PaxOcean, DHL, Rome’s Leonardo da Vinci International Airport and the Changi Airport Terminal 5 build.
“This round strengthens our local teams in the US, Japan, Australia and the Gulf, as we focus on harsh outdoor industrial environments. We are building a global industrial AI company from Singapore,” said Lenard Tan, Co-Founder and CEO of Ailytics.
Built for heavy industries anywhere
Ailytics’ proprietary product, Ailyssa, derives three-dimensional spatial understanding from a single two-dimensional feed and works through rain, dust, poor lighting with decades-old cameras. provide real-time actionable insights. Its latest reasoning engine, AilyssaX, process contextual scenes on the move and verify multi-step procedures, enabling more accurate and meaningful alerts.
“This round lets us build our own domain-specific reasoning models and keep the cost of running AI low as demand grows,” said Prateek Manocha, Co-Founder and CTO of Ailytics.
“Ailytics has reached 15 markets with very robust unit economics and client churn below 1 per cent. We want to be right behind the team as it scales globally,” said Jeremy Tan, Co-Founder and Managing Partner at Tin Men Capital.
About Ailytics
Ailytics turns existing CCTV into a real-time AI safety and operations layer for heavy industries. Founded in Singapore in 2021, it has more than 400 deployments across 15 countries. For more information, visit ailytics.ai.
Media Contact
marketing@ailytics.ai
https://www.ailytics.ai/
 View original content to download multimedia:https://www.prnewswire.co.uk/news-releases/tin-men-capital-leads-us7-4m-series-a-for-vision-ai-startup-ailytics-to-expand-across-apac-us-and-gulf-302918676.html

25, Oct 2026
DiDi Shareholders Overwhelmingly Back Hong Kong Relisting; Want Independent Director, Open Earnings Calls, and First Shareholder Meeting in Four Years, Survey Finds
A Heng Ren Partners survey this month finds at least 99.3% support on five key shareholder issues to boost shareholder value; shareholders want DiDi’s board and management to respond with concrete action
BOSTON, Oct. 26, 2026 /PRNewswire/ — Heng Ren Partners LLC, an active asset manager whose fund owns shares of “the Uber of China,” DiDi Global Inc. (OTC Pink: DIDIY), today released the results of a survey of DiDi shareholders showing near-unanimous support for relisting the company’s depressed shares on the Hong Kong Stock Exchange.
In 2022 DiDi’s shares were delisted from the New York Stock Exchange (NYSE) and moved to trade only OTC (over-the-counter) in the U.S. Despite delivering the most rides in the world, DiDi shares languish because its OTC status disqualifies it from indexes, and most institutional investors avoid buying OTC stocks, which are mostly penny stocks or shell companies. Heng Ren believes a relisting in Hong Kong is the best opportunity for realizing shareholder value and is campaigning for the change in trading venue.
DiDi shares are trading at close to $3.00 down 79% versus the 2021 IPO price of $14.00 per American Depositary Share (ADS). DiDi shares are down approximately 52% in the past year. Aside from the OTC discount, DiDi’s lack of communication with shareholders – no shareholder meetings, no public earnings calls – and lack of full board representation, all heighten the perceived risk of investment in DiDi.
Shareholders answered each of the survey’s five questions, and at least 99.3% of respondents answered that they want change:
Key findings:
- Hong Kong relisting: 144 respondents to this question (99.3%) want DiDi’s shares listed on the Hong Kong Stock Exchange instead of trading OTC in the U.S.
- Shareholders’ meeting: All 147 respondents (100%) want DiDi’s board to call a shareholders’ meeting to discuss the relisting plan.
- Relisting plan: All 145 respondents (100%) want DiDi to disclose its plan for relisting the shares in Hong Kong.
- Earnings calls: 146 respondents (99.3%) want DiDi to open its quarterly earnings calls to all shareholders.
- Independent director: 146 respondents (99.3%) want an election in which shareholders can nominate and choose an independent director to fill a vacant board seat and represent them.
DiDi’s shares have traded over-the-counter in the U.S. since the company’s June 2022 delisting from the New York Stock Exchange. In December 2021, DiDi announced that it would start preparations for a listing in Hong Kong. To Heng Ren’s knowledge, DiDi has not publicly announced a plan or timetable since, and it has not held a shareholders’ meeting since 2022.
“DiDi’s shareholders have spoken in their answers to this survey, and their message is clear and consistent,” said Peter Halesworth, founder, Managing Partner and Chief Investment Officer of Heng Ren Partners in Boston. “Relist, re-engage, and understand we want representation. These are modest requests that any global public company should be able to meet: tell us the plan to relist in Hong Kong, meet with us, open your earnings calls to everyone, and let us elect an independent director.
“We believe relisting in Hong Kong is the most rational outcome for all shareholders, and we think it is consistent with the direction Beijing has encouraged. We call on DiDi’s board and management to respond positively with concrete action,” Halesworth said.
Taken together, shareholders are making four requests of DiDi’s board and management: tell shareholders the plan and timetable for relisting in Hong Kong; hold a shareholders’ meeting to discuss shareholder issues; open quarterly earnings calls to all shareholders and interested investors; and let shareholders nominate and elect an independent director.
Heng Ren and shareholders have written letters to DiDi’s board and management, and also contacted DiDi’s largest shareholders asking them to support relisting in Hong Kong, including SoftBank Group Corp. (TSE: 9984) which owns approximately 21.5% of DiDi’s shares, Uber Technologies, Inc. (NYSE: UBER), a 12.8% shareholder, and Tencent Holdings Ltd. (HKEx: 0700), a 7.1% shareholder of DiDi.
“None of this will happen unless all shareholders ask for it,” Halesworth said.
Heng Ren Partners LLC invites DiDi shareholders to stay up-to-date and engage in its initiative to see DiDi’s shares listed on the Hong Kong Stock Exchange. Visit https://www.hengreninvestment.com/ and click “Bring DiDi Home” for details about the campaign.
About the survey: The survey asked five Yes-or-No questions and was conducted from October 16 to 21, 2026. Participation was voluntary, and the results reflect the views of the hundreds of shareholders surveyed. It is not a scientific sample of all DiDi shareholders.
About Heng Ren Partners
Heng Ren Partners LLC is an SEC-registered investment adviser based in Boston. It manages Heng Ren Investments LP, established in 2013, and Heng Ren Silk Road Investments LLC, a fund launched in 2018. For more information, visit www.hengreninvestment.com.
Media Contact:
Peter Halesworth
Founder & CIO
Heng Ren Partners LLC
info@hengreninvestment.com
Related Links
https://www.hengreninvestment.com

25, Oct 2026
ST Engineering iDirect and MBSat Partner to Build Next-Generation Sovereign Connectivity Services Across Oman and the Middle East
Intuition ground system selected to support MBSat’s planned 2027 service launch, enabling accelerated deployment, dynamic resource management and scalable service growth
HERNDON, Va., Oct. 25, 2026 /PRNewswire/ — ST Engineering iDirect today announced a strategic partnership with Mohammed Al Barwani Satellite Company (MBSat), part of Mohammed Al Barwani Group, to provide the ground system technology foundation for MBSat’s next-generation satellite gateway and network operations across Oman and the wider Middle East region. Intuition will provide a flexible, software-defined foundation to support sovereign connectivity services, enabling efficient service deployment, dynamic resource management and scalable network operations.

Intuition will deliver a turnkey ground segment solution that accelerates deployment, simplifies operations and gives MBSat the flexibility to scale services as demand grows. The software-defined platform enables dynamic resource management, service automation and seamless integration with existing and future operational systems. The solution also includes Ka-band gateway infrastructure, service provisioning and management capabilities, open API integration frameworks, training and full-lifecycle support. Together, these capabilities will help MBSat launch and operate services efficiently while adapting to evolving market requirements.
The network will leverage capacity from MB Sat-1, a sovereign MicroGEO satellite, with planned service launch in 2027, to support flexible, scalable connectivity services across the region.
The partnership reflects growing investment in sovereign communications infrastructure across the Middle East as operators seek greater control over service delivery, network expansion and long-term technology evolution.
“This partnership represents an important milestone in our efforts to build an advanced satellite communications platform in Oman and the region,” said Ammar Al Rawahi, General Manager, MBSat. “Through our collaboration with ST Engineering iDirect, we are establishing the technical infrastructure required to launch services efficiently, respond to evolving customer needs and expand into new markets, supporting the sustainable long-term growth of our business.”
“We are providing MBSat with a flexible, software-defined ground platform that integrates with its existing operational environment,” said Sridhar Kuppanna, Chief Executive Officer, ST Engineering iDirect. “This enables more efficient service deployment and operations today, with the flexibility to scale, introduce new capabilities and evolve as requirements change.”
About ST Engineering iDirect
ST Engineering iDirect, a subsidiary of ST Engineering, is a global leader in satellite communications, providing technology and solutions that enable its customers to expand their business, differentiate their services and optimize their networks. Through its portfolio of ground infrastructure, intelligent networking and advanced satellite communications solutions, the company supports operators, service providers, governments and enterprises worldwide.
 View original content to download multimedia:https://www.prnewswire.co.uk/news-releases/st-engineering-idirect-and-mbsat-partner-to-build-next-generation-sovereign-connectivity-services-across-oman-and-the-middle-east-302918478.html

24, Oct 2026
Philip Morris International Reports 2026 Third-Quarter & First Nine-Months Results and Updates 2026 Full-Year Adjusted Diluted EPS Forecast for Currency Only
Third-Quarter Reported Diluted EPS declined by 4.9% to $2.12;
Adjusted Diluted EPS grew by 5.4% to $2.36; and by 5.8% excluding currency
STAMFORD, Conn. and NEW DELHI, Oct. 23, 2026 /PRNewswire/ — Philip Morris International Inc. (PMI) (NYSE: PM) today announces its 2026 third-quarter results.1
“We delivered another excellent quarter, with growing total volumes, double-digit organic operating income growth and robust margin expansion,” said Jacek Olczak, Group CEO, PMI.
“With continued strong offtake momentum for our smoke-free brands and the exceptional results of our combustible business, we are in a strong position to continue delivering best-in-class performance, and firmly on track for a sixth consecutive year of volume growth.”
1 Explanation of PMI’s use of non-GAAP measures cited in this document and reconciliations to the most directly comparable U.S. GAAP measures can be found in the “Non-GAAP Measures, Glossary and Explanatory Notes” section of this release, in Exhibit 99.2 to the company’s Form 8-K dated October 21, 2026, and here.
Results Highlights – Third Quarter 2026
Shipments increased by 0.6% in the quarter, driven by a 2.7% increase in smoke-free products (SFP), with shipment growth across all categories, supported by high single-digit growth in SFP adjusted in-market sales (IMS), which is the closest proxy to consumer offtake. This was complemented by the continuing resilience of the combustible segment, notably in markets where SFPs are banned or have a limited market presence.
Net revenues increased by 5.5% (7.1% organically) to $11.4 billion, with growth across both smoke-free (up by 4.1%, 6.3% organically) and combustibles (up by 6.4%, 7.7% organically). Our smoke-free business accounted for more than 40% of total net revenues in the third quarter, and around 42% on a year-to-date basis, with more than 30 markets above 50%. PMI smoke-free products are now available in 110 markets.
Gross profit increased by 6.7% (8.3% organically), expanding gross margins through strong combustible pricing, scale and SFP mix benefits. Operating income increased by 14.1% (10.5% organically), reflecting the underlying strength of the business. This strong financial performance represents a new record quarterly high of net revenue, gross profit and operating income for the group.
Reported diluted EPS of $2.12 declined by 4.9%, mainly due to the non-cash fair value adjustment for equity security investments. Adjusted diluted EPS grew by 5.4%, or by 5.8% excluding a one cent unfavorable currency impact to reach $2.36, another quarterly all-time high.
International Smoke-Free Segment
Net revenue growth of 0.7% (3.4% organically) was driven by 2.7% volume growth, against the backdrop of a challenging HTU comparison due to the phasing of shipments between periods, notably in Japan. Strong adjusted IMS momentum continued, with an acceleration to 8.0% growth. Gross profit grew by 0.8% (3.3% organically).
Heat-not-burn SFP: IQOS continued to lead the growth of the global category, in which PMI holds around three-quarters of HTU volume share. IQOS HTUs gained 1.0pp to reach 9.9% of combined cigarette and HTU industry volumes in markets where present and grew shipment volumes by 1.5% to 41.5 billion units, at the high end of our previously disclosed expectations. HTU adjusted IMS grew by 7.1%. Excluding Japan and Poland, adjusted IMS continued to grow in the double digits, increasing by 10%, reflecting broad-based growth across a variety of markets, underscoring the increasing geographic diversification of IQOS.
- In Japan, PMI HTU adjusted IMS grew by 3.4%, or by 1.3% excluding the estimated consumer pantry-loading impact ahead of the October 1 excise-driven price increase (JPY20 per pack). This continues to be broadly in line with our expectations as consumers adjust following the first excise-driven price increase (JPY40 per pack) on April 1. IQOS maintained a strong category share at 68%, with SENTIA continuing to play a key role in capturing price-sensitive TEREA consumers.
- In Europe, IQOS HTU adjusted IMS growth strengthened to an estimated 6.0%, notwithstanding ongoing disruptions in Ukraine and the continued impact of the characterizing flavor ban in Poland. IQOS HTU adjusted market share increased by 0.9pp to 11.6%. This growth was led by strong performance in many markets, notably Germany, Greece, Spain and Romania. Adjusted IMS in Italy continued its strong growth trajectory, underscoring the category’s significant potential across the region. Excluding Poland, adjusted IMS volumes grew by around 8%.
- Outside Europe and Japan, adjusted IMS grew by 12.7% and offtake share increased in key cities across the globe, including Riyadh, Kuala Lumpur, Mexico City, Jakarta and Taipei, underlining the global growth potential of the heat-not-burn category.
Oral SFP: Total oral SFP volumes turned positive, increasing by 0.5%, as growth in modern oral of 20.6% to 0.5 billion pouches more than offset declines in the legacy Nordic snus business. We continue to expand ZYN‘s footprint, with ZYN now available in 62 international markets and showing promising growth in geographies such as Global Travel Retail, Poland, and the Philippines, as well as sequential improvements in Sweden.
E-vapor SFP: We continue to drive outstanding growth in VEEV, with quarterly shipments up by 61.6%. VEEV further reinforced its leadership position in Europe, with strong growth across a range of markets, notably Romania, Greece, France and Spain. VEEV is also demonstrating promising results in markets outside of Europe, such as Indonesia, Global Travel Retail, Egypt, Malaysia and South Korea following the launch in August. PMI remains committed to building and commercializing the brand in a focused, responsible and profitable manner, leveraging its key role as part of our multicategory portfolio.
International Combustibles Segment
The combustibles segment delivered an exceptional quarter, with cigarette volume continuing to show strong resilience with broadly flat shipments. This was notably due to strong growth in markets such as Turkey, Indonesia and Egypt, which offset declines in other markets. Net revenues grew by 6.5% (7.8% organically), driven by another impressive quarter of 8.9% pricing, partly offset by geographic mix. This quarter also benefited from the favorable restructuring of distribution terms in certain markets, which is not expected to recur at the same level in future quarters. Gross profit grew by 8.6% (9.8% organically). Our cigarette category volume share stood at 25.9% (up by 0.4pp) despite adverse market mix. Marlboro continued to gain share (up by 0.5pp) reaching a record category share of 11.4%.
U.S. Segment
In the U.S., total ZYN shipments grew by 4.2% to 3.2 billion pouches, despite challenging comparisons against a special promotional campaign last year and supported by the ongoing launches of ZYN ULTRA, new flagship dry flavors, 1.5mg and 8mg flagship variants. These portfolio extensions enable ZYN to cover a broader range of consumer preferences and compete in the most dynamic growing segments of the category. Segment net revenues grew by 22.7% and gross profit by 24.2% (23.8% organically), driven by volume growth combined with favorable pricing comparisons due to prior year promotional activities. Operating companies income decreased by 3.3% (increased by 1.5% organically), including a significant increase in commercial investments to support the expansion of our ZYN portfolio, which increased its category share by over 100 basis points between June and September, as estimated by Nielsen.
As part of our previously announced plans to accelerate investments in the second half, and with distribution of the extended range of ZYN products continuing to progress, we plan to further increase investments to support the brand in the fourth quarter. This reflects a ramp-up in consumer communications, notably an expansion of the ‘When It Clicks‘ brand campaign, and the transition of the majority of the ZYN flagship portfolio to 20-pouch cans (from 15-pouch cans today), including associated transitional support programs. The change to 20-pouch cans is designed to align the value proposition across the portfolio and optimize ZYN’s price premium to support future growth in the dynamic U.S. nicotine pouch category.
On August 21, the FDA granted PMTA authorization to 11 variants of ZYN ULTRA, our higher-nicotine moist offering. ZYN now has PMTA authorization of 31 variants in total, more than any other nicotine brand on the market. This, combined with the MRTP authorization of 20 ZYN flagship variants on June 30, underlines the robustness of the science behind our products and their potential to reduce the harm caused by smoking.
Dividend: Increased regular quarterly dividend by 8.8% to $1.60 per share, or an annualized $6.40 per share.
|
Third-Quarter 2026 Performance Highlights |
||||||||||||||||
|
Shipment Volume |
PMI |
International |
International |
U.S. |
||||||||||||
|
Q3 |
vs. PY |
Q3 |
vs. PY |
Q3 |
vs. PY |
Q3 |
vs. PY |
|||||||||
|
Total |
206.2 |
0.60 % |
44.5 |
2.70 % |
158.0 |
— % |
3.7 |
2.30 % |
||||||||
|
Cigarettes |
158.0 |
— % |
158.0 |
— % |
||||||||||||
|
SFP |
48.2 |
2.70 % |
44.5 |
2.70 % |
3.7 |
2.30 % |
||||||||||
|
HTU |
41.5 |
1.50 % |
41.5 |
1.50 % |
– |
(14.30) % |
||||||||||
|
Oral SFP |
5.3 |
1.80 % |
1.6 |
0.50 % |
3.7 |
2.30 % |
||||||||||
|
E-Vapor |
1.4 |
61.60 % |
1.4 |
61.60 % |
||||||||||||
|
“-” indicates zero volumes or less than 50 million units |
||||||||||||||||
|
PMI |
International |
International |
U.S. |
|||||||||||||
|
Net Revenues ($ bn) |
$11.4 |
$3.9 |
$6.7 |
$0.8 |
||||||||||||
|
reported vs. Q3 2025 |
5.50 % |
0.70 % |
6.50 % |
22.70 % |
||||||||||||
|
organic vs. Q3 2025 |
7.10 % |
3.40 % |
7.80 % |
22.70 % |
||||||||||||
|
Gross Profit ($ bn) |
$7.9 |
$2.7 |
$4.6 |
$0.5 |
||||||||||||
|
reported vs. Q3 2025 |
6.70 % |
0.80 % |
8.60 % |
24.20 % |
||||||||||||
|
organic vs. Q3 2025 |
8.30 % |
3.30 % |
9.80 % |
23.80 % |
||||||||||||
|
OCI ($ bn) |
$4.9 |
$4.9 |
$— |
|||||||||||||
|
reported vs. Q3 2025 |
13.00 % |
12.90 % |
(3.30) % |
|||||||||||||
|
organic vs. Q3 2025 |
10.50 % |
10.80 % |
1.50 % |
|||||||||||||
|
Operating Income ($ bn) |
$4.9 |
|||||||||||||||
|
reported vs. Q3 2025 |
14.10 % |
|||||||||||||||
|
organic vs. Q3 2025 |
10.50 % |
|||||||||||||||
|
Note: Sums might not foot to total due to rounding. |
||||||||||||||||
|
2026 |
2025 |
Change |
||||||||||||||
|
Reported Diluted EPS |
$2.12 |
$2.23 |
(4.90) % |
|||||||||||||
|
Amortization of intangibles |
0.13 |
0.13 |
||||||||||||||
|
Fair value adjustment for equity security investments |
0.06 |
(0.07) |
||||||||||||||
|
Income tax impact associated with Swedish Match AB financing |
0.01 |
– |
||||||||||||||
|
Dutch pension plan buy-out loss |
0.04 |
– |
||||||||||||||
|
Germany excise tax classification litigation charge |
– |
0.1 |
||||||||||||||
|
RBH (Canada) Plan Implementation, including dividend income, net |
– |
(0.10) |
||||||||||||||
|
Impairment of Wellness business related equity investment |
– |
0.09 |
||||||||||||||
|
Tax items |
– |
(0.14) |
||||||||||||||
|
Adjusted Diluted EPS |
$2.360 |
$2.24 |
5.40 % |
|||||||||||||
|
Less: Currency |
(0.01) |
|||||||||||||||
|
Adjusted Diluted EPS, excluding Currency |
$2.37 |
$2.24 |
5.80 % |
|||||||||||||
|
First Nine-Months 2026 Performance Highlights |
||||||||||||||||
|
Shipment Volume (billion equivalent units) |
PMI |
International |
International |
U.S. |
||||||||||||
|
YTD |
vs. PY |
YTD |
vs. PY |
YTD |
vs. PY |
YTD |
vs. PY |
|||||||||
|
Total |
595.6 |
0.50 % |
133.3 |
7.40 % |
452.2 |
(1.20) % |
10.1 |
(5.80) % |
||||||||
|
Cigarettes |
452.2 |
(1.20) % |
452.2 |
(1.20) % |
||||||||||||
|
SFP |
143.4 |
6.40 % |
133.3 |
7.40 % |
10.1 |
(5.80) % |
||||||||||
|
HTU |
124.5 |
6.70 % |
124.5 |
6.70 % |
– |
+100 % |
||||||||||
|
Oral SFP |
14.9 |
(5.30) % |
4.8 |
(4.00) % |
10.0 |
(5.80) % |
||||||||||
|
E-Vapor |
4.0 |
68.10 % |
4.0 |
68.10 % |
||||||||||||
|
“-” indicates zero volumes or less than 50 million units |
||||||||||||||||
|
PMI |
International |
International |
U.S. |
|||||||||||||
|
Net Revenues ($ bn) |
$32.8 |
$11.6 |
$18.9 |
$2.3 |
||||||||||||
|
reported vs. YTD 2025 |
8.20 % |
12.30 % |
7.70 % |
(5.20) % |
||||||||||||
|
organic vs. YTD 2025 |
5.90 % |
9.90 % |
5.20 % |
(5.50) % |
||||||||||||
|
Gross Profit ($ bn) |
$22.4 |
$8.1 |
$12.8 |
$1.5 |
||||||||||||
|
reported vs. YTD 2025 |
9.40 % |
14.30 % |
9.90 % |
(14.80) % |
||||||||||||
|
organic vs. YTD 2025 |
7.10 % |
11.80 % |
7.40 % |
(14.60) % |
||||||||||||
|
OCI ($ bn) |
$13.6 |
$13.7 |
$(0.1) |
|||||||||||||
|
reported vs. YTD 2025 |
13.40 % |
17.60 % |
-(100) % |
|||||||||||||
|
organic vs. YTD 2025 |
7.60 % |
11.40 % |
(41.10) % |
|||||||||||||
|
Operating Income ($ bn) |
$13.3 |
|||||||||||||||
|
reported vs. YTD 2025 |
15.40 % |
|||||||||||||||
|
organic vs. YTD 2025 |
7.70 % |
|||||||||||||||
|
Note: Sums might not foot to total due to rounding. |
||||||||||||||||
|
2026 |
2025 |
Change |
||||||||||||||
|
Reported Diluted EPS |
$5.48 |
$5.89 |
(7.00) % |
|||||||||||||
|
Amortization of intangibles |
0.37 |
0.37 |
||||||||||||||
|
Fair value adjustment for equity security investments |
0.22 |
(0.33) |
||||||||||||||
|
Restructuring charges |
0.02 |
0.13 |
||||||||||||||
|
Income tax impact associated with Swedish Match AB financing |
0.07 |
(0.24) |
||||||||||||||
|
Impairment related to the RBH equity investment |
0.33 |
– |
||||||||||||||
|
Egypt sales tax settlement adjustment |
(0.01) |
– |
||||||||||||||
|
Dutch pension plan buy-out loss |
0.04 |
– |
||||||||||||||
|
Impairment of goodwill |
– |
0.03 |
||||||||||||||
|
Germany excise tax classification litigation charge |
– |
0.1 |
||||||||||||||
|
RBH (Canada) Plan Implementation, including dividend income, net |
– |
(0.10) |
||||||||||||||
|
Impairment of Wellness business related equity investment |
– |
0.09 |
||||||||||||||
|
Tax items |
– |
(0.11) |
||||||||||||||
|
Adjusted Diluted EPS |
$6.52 |
$5.83 |
11.80 % |
|||||||||||||
|
Less: Currency |
0.2 |
|||||||||||||||
|
Adjusted Diluted EPS, excluding Currency |
$6.32 |
$5.83 |
8.40 % |
|||||||||||||
Impact of Geopolitical Conflicts
While the impact of the ongoing Middle East conflict on the group remains manageable, it has had an increasing effect on our business, with energy-related inflation driving incremental cost pressures in the third quarter. In our full-year forecast, we assume the observed rise in energy-related input prices to have a slightly higher impact in the fourth quarter, as a larger proportion of input price increases take effect. The long-term situation remains unpredictable, and it is difficult to assess the broader implications for consumers or the global cost environment.
In addition, the evolution of the situation in Ukraine has caused certain disruptions to our business this year, including the impact of strikes on our supply chain and logistics infrastructure in certain locations. We expect this disruption to have an impact on our operating income this year.
|
2026 Full-Year Forecast |
||||||
|
2026 |
2025 |
Growth |
||||
|
Reported Diluted EPS |
$7.11 – $7.26 |
$ 7.26 |
||||
|
Adjustments |
||||||
|
Amortization of intangibles |
0.50 |
0.50 |
||||
|
Fair value adjustment for equity security investments |
0.22 |
(0.18) |
||||
|
Restructuring charges |
0.03 |
0.14 |
||||
|
Income tax impact associated with Swedish Match AB financing |
0.07 |
(0.25) |
||||
|
Impairment related to the RBH equity investment |
0.33 |
— |
||||
|
Egypt sales tax settlement adjustment |
(0.01) |
— |
||||
|
Dutch pension plan buy-out loss |
0.04 |
— |
||||
|
Other 2025 adjustments(1) |
— |
0.07 |
||||
|
Total Adjustments |
1.18 |
0.28 |
||||
|
Adjusted Diluted EPS |
$8.29 – $8.44 |
$ 7.54 |
9.9% – 11.9% |
|||
|
Less: Currency |
0.18 |
|||||
|
Adjusted Diluted EPS, excluding currency |
$8.11 – $8.26 |
$ 7.54 |
7.5% – 9.5% |
|||
|
(1) Includes: $0.10 Germany excise tax classification litigation charge; ($0.10) RBH (Canada) Plan Implementation, including dividend income, net; $0.09 |
||||||
Reported diluted EPS is forecast to be in a range of $7.11 to $7.26, at prevailing exchange rates. Excluding a total 2026 adjustment of $1.18 per share, this forecast represents a projected increase of 9.9% to 11.9% versus adjusted diluted EPS of $7.54 in 2025. This includes a favorable currency impact of $0.18, at prevailing exchange rates (previously $0.24). Excluding currency, this forecast represents a projected increase of 7.5% to 9.5% versus adjusted diluted EPS of $7.54 in 2025, as outlined in the above table.
2026 Full-Year Forecast Assumptions
- Growing (previously broadly stable to slightly growing) total PMI cigarette and SFP shipment volume, with high single-digit SFP shipment growth, led by high single-digit SFP adjusted IMS growth, and a cigarette shipment volume decline at a similar level to the year-to-date trend (previously around 2% to 3%);
- Net revenue growth of 5% to 7% on an organic basis; with a greater likelihood to be in the middle or upper-half of the range, supported by a fourth-quarter reacceleration in international smoke-free;
- Organic operating income growth of 7% to 9%; with a greater likelihood to be in the middle or lower-half of the range, with a corresponding flow through to our EPS forecast range, given the cost impacts of ongoing geopolitical tensions and the previously communicated step-up in U.S. growth investments;
- Full-year amortization of acquired intangibles of $0.50 per share;
- Broadly stable net financing costs;
- An effective tax rate, excluding discrete tax events, of around 21.5%;
- Operating cash flow around $13.5 billion at prevailing exchange rates, subject to year-end working capital requirements;
- Capital expenditures of $1.4 to $1.6 billion, predominantly supporting the smoke-free business;
- Further net debt to adjusted EBITDA ratio improvement as we target a ratio of close to 2.0x by the end of 2026, at prevailing exchange rates; and
- No share repurchases.
Factors described in the Forward-Looking and Cautionary Statements section of this release represent continuing risks to these projections.
|
Third-Quarter 2026 Operating Review |
||||||||
|
Net Revenues |
PMI |
International |
International |
U.S. |
||||
|
2025 |
$10,845 |
$3,839 |
$6,316 |
$689 |
||||
|
Price |
739 |
21 |
565 |
153 |
||||
|
Volume/Mix/Other |
36 |
108 |
(75) |
4 |
||||
|
Acquisitions & Divestitures |
(27) |
(27) |
— |
— |
||||
|
Currency |
(155) |
(74) |
(81) |
(1) |
||||
|
2026 |
$11,438 |
$3,867 |
$6,725 |
$845 |
||||
|
vs. Q3 2025 |
5.50 % |
0.7 % |
6.5 % |
22.7 % |
||||
|
Organic growth |
7.10 % |
3.4 % |
7.8 % |
22.7 % |
||||
|
Gross Profit |
PMI |
International |
International |
U.S. |
||||
|
2025 |
$7,361 |
$2,683 |
$4,244 |
$434 |
||||
|
Price |
739 |
21 |
565 |
153 |
||||
|
Volume/Mix/Other |
(23) |
87 |
(99) |
(9) |
||||
|
Cost |
(104) |
(18) |
(48) |
(39) |
||||
|
Acquisitions & Divestitures |
(7) |
(7) |
— |
— |
||||
|
Currency |
(112) |
(60) |
(52) |
— |
||||
|
2026 |
$7,854 |
$2,705 |
$4,610 |
$539 |
||||
|
vs. Q3 2025 |
6.70 % |
0.80 % |
8.60 % |
24.20 % |
||||
|
Adjustments* |
6 |
1 |
— |
5 |
||||
|
2026 Adjusted Gross Profit |
$7,860 |
$2,705 |
$4,610 |
$544 |
||||
|
vs. Q3 2025 |
6.70 % |
0.80 % |
8.60 % |
23.90 % |
||||
|
Organic growth |
8.30 % |
3.30 % |
9.80 % |
23.80 % |
||||
|
2026 Adj. Gross Profit Margin |
68.70 % |
70.00 % |
68.50 % |
64.40 % |
||||
|
vs. Q3 2025 |
0.8pp |
0.1pp |
1.3pp |
0.7pp |
||||
|
Organic growth |
0.8pp |
—pp |
1.3pp |
0.6pp |
||||
|
(*) For a list of adjusting items refer to the “Non-GAAP Measures, Glossary and Explanatory Notes” section of this release, in Exhibit |
||||||||
|
PMI (in millions) |
Variance |
|||||||||||||||||
|
2026 |
2025 |
Change |
Total |
Price |
Volume / |
Cost |
Acq. / |
Currency |
||||||||||
|
Net Revenues |
11,438 |
10,845 |
5.50 % |
593 |
739 |
36 |
– |
(27) |
(155) |
|||||||||
|
Cost of Sales (1) |
(3,584) |
(3,484) |
(2.90) % |
(100) |
– |
(59) |
(104) |
20 |
43 |
|||||||||
|
Gross Profit |
7,854 |
7,361 |
6.70 % |
493 |
739 |
(23) |
(104) |
(7) |
(112) |
|||||||||
|
Marketing, Administration and Research Costs (2) |
(2,993) |
(3,058) |
2.10 % |
65 |
– |
– |
40 |
4 |
21 |
|||||||||
|
Corporate Expenses & Other |
5 |
(40) |
+100 % |
45 |
– |
– |
(7) |
– |
52 |
|||||||||
|
Operating Income |
4,866 |
4,263 |
14.10 % |
603 |
739 |
(23) |
(71) |
(3) |
(39) |
|||||||||
|
Adjustments* |
(251) |
(407) |
38.30 % |
156 |
– |
– |
156 |
– |
– |
|||||||||
|
Adj. Operating Income |
5,117 |
4,670 |
9.60 % |
447 |
739 |
(23) |
(227) |
(3) |
(39) |
|||||||||
|
Adj. OI Margin |
44.70 % |
43.10 % |
1.6pp |
|||||||||||||||
|
(1) Includes $6 million in 2026 and $5 million in 2025 related to the adjusting items shown below Operating Income |
||||||||||||||||||
|
(2) Includes $245 million in 2026 and $402 million in 2025 related to the adjusting items shown below Operating Income |
||||||||||||||||||
|
(*) For a list of adjusting items refer to Exhibit 99.2 to the company’s Form 8-K dated October 21, 2026. |
||||||||||||||||||
|
Note: Sums might not foot to total due to rounding. |
||||||||||||||||||
Total PMI
- Estimated industry volume (excluding China and the U.S.) for cigarettes and HTUs was broadly stable, decreasing by 0.1%.
- Net revenues increased by 7.1% organically, mainly reflecting: a favorable pricing variance driven by international combustibles and the U.S. segment.
- Operating income increased by 10.5% on an organic basis, largely reflecting the same factors as for net revenues.
International Smoke-Free Segment
- Shipment volume grew by 2.7%, with broad-based growth across markets, notably Taiwan, Global Travel Retail, Greece, Germany, and Bulgaria, notwithstanding a challenging HTU comparison due to phasing of shipments between periods.
- Net revenues increased by 3.4% on an organic basis, reflecting: a favorable volume/mix driven by higher HTU and e-vapor volumes and a favorable pricing variance due to HTUs.
- Gross profit increased by 3.3% organically mainly due to the same factors as for net revenues.
International Combustibles Segment
- Shipment volumes were broadly flat with notable increases in Turkey, Indonesia, and Egypt, offsetting declines in markets such as Russia, Poland and Japan.
- Net revenues increased by 7.8% on an organic basis, reflecting: a favorable pricing variance, the restructuring of distribution terms in certain markets, and partially offset by unfavorable geographic mix.
- Gross profit increased by 9.8% organically due to the same factors as for net revenues, slightly offset by higher costs due to increases in energy-related input prices.
U.S. Segment
- Net revenues increased by 22.7%, primarily reflecting: growing ZYN shipments of 4.2%, and a favorable price variance against prior year promotions, supported by growth in the Wellness business and cigars.
- Gross profit increased by 23.8% on an organic basis reflecting the same factors as for net revenues, partly offset by higher manufacturing costs linked to the expansion of our footprint.
- Adjusted OCI increased by 1.5% organically, to $171 million, reflecting the same factors as for adjusted gross profit and the start of increased marketing investments to support the expanded ZYN portfolio.
|
First Nine-Months 2026 Operating Review – Net Revenues |
||||
|
(in millions) |
PMI |
International |
International |
U.S. |
|
2025 |
$30,286 |
$10,310 |
$17,525 |
$2,451 |
|
Price |
1,889 |
195 |
1,607 |
88 |
|
Volume/Mix/Other |
(89) |
823 |
(689) |
(222) |
|
Acquisitions & Divestitures |
(44) |
(44) |
— |
— |
|
Currency |
734 |
297 |
429 |
8 |
|
2026 |
$32,776 |
$11,580 |
$18,872 |
$2,324 |
|
vs. YTD 2025 |
8.2 % |
12.3 % |
7.7 % |
(5.2) % |
|
Organic growth |
5.9 % |
9.9 % |
5.2 % |
(5.5) % |
|
Gross Profit |
PMI |
International |
International |
U.S. |
||||
|
2025 |
$20,497 |
$7,088 |
$11,679 |
$1,729 |
||||
|
Price |
1,889 |
195 |
1,607 |
88 |
||||
|
Volume/Mix/Other |
(261) |
575 |
(621) |
(214) |
||||
|
Cost |
(179) |
65 |
(116) |
(128) |
||||
|
Acquisitions & Divestitures |
(11) |
(11) |
— |
— |
||||
|
Currency |
483 |
194 |
290 |
(1) |
||||
|
2026 |
$22,418 |
$8,105 |
$12,839 |
$1,473 |
||||
|
vs. YTD 2025 |
9.4 % |
14.3 % |
9.9 % |
(14.8) % |
||||
|
Adjustments* |
18 |
2 |
— |
16 |
||||
|
2026 Adjusted Gross Profit |
$22,436 |
$8,107 |
$12,839 |
$1,489 |
||||
|
vs. YTD 2025 |
9.4 % |
14.3 % |
9.9 % |
(14.6) % |
||||
|
Organic growth |
7.1 % |
11.8 % |
7.4 % |
(14.6) % |
||||
|
2026 Adj. Gross Profit Margin |
68.5 % |
70.0 % |
68.0 % |
64.1 % |
||||
|
vs. YTD 2025 |
0.8pp |
1.2pp |
1.4pp |
(7.1)pp |
||||
|
Organic growth |
0.8pp |
1.2pp |
1.4pp |
(6.9)pp |
||||
|
(*) For a list of adjusting items refer to the “Non-GAAP Measures, Glossary and Explanatory Notes” section of this release, in Exhibit |
||||||||
|
PMI (in millions) |
Variance |
|||||||||||||||||
|
2026 |
2025 |
Change |
Total |
Price |
Volume / |
Cost |
Acq. / Divest. |
Currency |
||||||||||
|
Net Revenues |
32,776 |
30,286 |
8.20 % |
2,490 |
1,889 |
(89) |
– |
(44) |
734 |
|||||||||
|
Cost of Sales (1) |
(10,358) |
(9,789) |
(5.80) % |
(569) |
– |
(172) |
(179) |
33 |
(251) |
|||||||||
|
Gross Profit |
22,418 |
20,497 |
9.40 % |
1,921 |
1,889 |
(261) |
(179) |
(11) |
483 |
|||||||||
|
Marketing, Administration and Research Costs (2) |
(8,831) |
(8,474) |
(4.20) % |
(357) |
– |
– |
(76) |
6 |
(287) |
|||||||||
|
Impairment of Goodwill |
— |
(41) |
+100 % |
41 |
– |
– |
41 |
– |
– |
|||||||||
|
Corporate Expenses & Other |
(298) |
(463) |
35.60 % |
165 |
– |
– |
(18) |
– |
183 |
|||||||||
|
Operating Income |
13,289 |
11,519 |
15.40 % |
1,770 |
1,889 |
-261 |
-232 |
-5 |
379 |
|||||||||
|
Adjustments* |
(769) |
(1,187) |
35.20 % |
418 |
– |
– |
418 |
– |
– |
|||||||||
|
Adj. Operating Income |
14,058 |
12,706 |
10.60 % |
1,352 |
1,889 |
(261) |
(650) |
(5) |
379 |
|||||||||
|
Adj. OI Margin |
42.90 % |
42.00 % |
0.9pp |
|||||||||||||||
|
(1) Includes $18 million in 2026 and $16 million in 2025 related to the adjusting items shown below Operating Income |
||||||||||||||||||
|
(2) Includes $751 million in 2026 and $1,130 million in 2025 related to the adjusting items shown below Operating Income |
||||||||||||||||||
|
(*) For a list of adjusting items refer to the “Non-GAAP Measures, Glossary and Explanatory Notes” section of this release, in Exhibit 99.2 to the company’s Form 8-K dated October 21, 2026 |
||||||||||||||||||
|
Note: Sums might not foot to total due to rounding. |
||||||||||||||||||
Total PMI
- Estimated industry volume (excluding China and the U.S.) for cigarettes and HTUs declined by 0.4%.
- Net revenues increased by 5.9% organically, mainly reflecting: a favorable pricing variance mainly driven by international combustibles; higher international smoke-free volumes; partly offset by unfavorable volume/mix, mainly driven by lower international combustibles and U.S. volumes in the first quarter.
- Operating income increased by 7.7% on an organic basis, reflecting the same factors as for net revenues, partially offset by higher marketing, administration and research costs.
International Smoke-Free Segment
- Shipment volume grew by 7.4%, notably due to Taiwan, Greece, Italy, and Global Travel Retail.
- Net revenues increased by 9.9% on an organic basis, reflecting: a favorable volume/mix driven by higher HTU and e-vapor volumes and a favorable pricing variance due to higher HTU pricing.
- Gross profit increased by 11.8% organically mainly due to the same factors as for net revenues, supported by favorable manufacturing efficiencies.
International Combustibles Segment
- Shipment volume declined by 1.2% with notable decreases in Russia, Mexico, and Germany, partly offset by Turkey and Egypt.
- Net revenues increased by 5.2% on an organic basis, reflecting: a favorable pricing variance and the previously mentioned restructuring of distribution terms in certain markets, partially offset by unfavorable volume/mix.
- Gross profit increased by 7.4% organically due to the same factors as for net revenues, and slightly offset by increases in energy-related input prices.
U.S. Segment
- Net revenues decreased by 5.5% organically, reflecting: unfavorable dynamics in the first quarter with ZYN volumes impacted by distributor and trade inventory movements, slightly offset by favorable price comparisons against higher promotional activities in the third quarter last year.
- Gross profit decreased by 14.6% on an organic basis reflecting the same factors as for net revenues and higher manufacturing costs.
- Adjusted OCI decreased by 41.1% organically, to $550 million, reflecting the same factors as for gross profit and increased investments in marketing, administration and research costs.
Conference Call
A conference call hosted by Massimo Andolina, Group Chief Financial Officer, will be webcast at 9:00 a.m., Eastern Time, on October 21, 2026. The webcast can be accessed here. Further market data will be provided in an appendix to the webcast presentation.
Philip Morris International: A Global Smoke-Free Champion
Philip Morris International is a leading international consumer goods company, actively delivering a smoke-free future and evolving its portfolio for the long term to include products outside of the tobacco and nicotine sector. The company’s current product portfolio primarily consists of cigarettes and smoke-free products, including heat-not-burn, nicotine pouch and e-vapor products. Our smoke-free products are available for sale in 110 markets as of September 30, 2026. As of December 31, 2025 PMI estimates they were used by over 43 million legal-age consumers around the world, many of whom have moved away from cigarettes or significantly reduced their consumption. The smoke-free business accounted for more than 40% of PMI’s third-quarter 2026 total net revenues. Since 2008, PMI has invested over $16 billion to develop, scientifically substantiate and commercialize innovative smoke-free products for legal-age adults who would otherwise smoke or use other nicotine-containing consumer products, with the goal of completely ending the sale of cigarettes. This includes the building of world-class scientific assessment capabilities, notably in the areas of pre-clinical systems toxicology, clinical and behavioral research, as well as post-market studies. Following a robust science-based review, the U.S. Food and Drug Administration has authorized the marketing of Swedish Match’s General snus and ZYN nicotine pouches and versions of PMI’s IQOS devices and consumables – the first-ever such authorizations in their respective categories. Versions of IQOS devices and consumables, General snus and 20 ZYN nicotine pouch variants also obtained the first-ever Modified Risk Tobacco Product authorizations from the FDA. With a strong foundation and significant expertise in life sciences, PMI has a long-term ambition to expand into wellness areas. References to “PMI”, “we”, “our” and “us” mean Philip Morris International Inc., and its subsidiaries. For more information, please visit www.pmi.com and www.pmiscience.com.
Forward-Looking and Cautionary Statements
This release contains projections of future results and goals and other forward-looking statements, including statements regarding expected financial or operational performance; capital allocation plans; investment strategies; regulatory outcomes; market expectations; business plans and strategies. Achievement of future results is subject to risks, uncertainties and inaccurate assumptions. In the event that risks or uncertainties materialize, or underlying assumptions prove inaccurate, actual results could vary materially from those contained in such forward-looking statements. Pursuant to the “safe harbor” provisions of the Private Securities Litigation Reform Act of 1995, PMI is identifying important factors that, individually or in the aggregate, could cause actual results and outcomes to differ materially from those contained in any forward-looking statements made by PMI.
PMI’s business risks include: marketing and regulatory restrictions that could reduce our competitiveness, disrupt our SFP commercialization efforts, eliminate our ability to communicate with adult consumers, or ban certain of our products in certain markets or countries; excise tax increases and discriminatory tax structures; health concerns relating to the use of tobacco and other nicotine-containing products; litigation related to tobacco and/ or nicotine products and intellectual property rights; intense competition; inability to anticipate changes in adult consumer preferences; use and reliance on third-parties; the adverse effects of global and individual country economic, regulatory and political developments, natural disasters and conflicts; geopolitical instability; the impact and consequences of Russia’s invasion of Ukraine; changes in legal-age adult smoker behavior; continued decline of tax-paid cigarettes; lost revenues as a result of counterfeiting, contraband and cross-border purchases; governmental investigations; unfavorable currency exchange rates and currency devaluations, sustained periods of elevated inflation, and limitations on the ability to repatriate funds; adverse changes in applicable corporate tax laws; disruptions in the credit markets or changes to its credit ratings; recent and potential future tariffs imposed by the U.S. and other countries; adverse changes in the cost, availability, and quality of tobacco and other agricultural products and raw materials, as well as product components for its electronic devices; and the integrity of its information systems and effectiveness of its data privacy policies. PMI’s future profitability may also be adversely affected should it be unsuccessful, in key markets or systemically, in its efforts to introduce, commercialize, and grow smoke-free products or if regulation or taxation do not differentiate between such products and cigarettes; if it is unable to successfully introduce new products, and promote brand equity; if there are prolonged disruptions of facilities used to produce its products; if it is unable to enter new markets or improve its margins through increased prices and productivity gains; if other market participants are more successful in their SFP commercialization efforts; if it is unable to attract and retain the best global talent; or if it is unable to successfully integrate and realize the expected benefits from recent transactions and acquisitions. Future results are also subject to the lower predictability of our smoke-free products performance.
PMI is further subject to other risks detailed from time to time in its publicly filed documents, including PMI’s Annual Report on Form 10-K for the fourth quarter and year ended December 31, 2025, and the Quarterly Report on Form 10-Q for the third quarter ended September 30, 2026, which will be filed in the coming days. PMI cautions that the foregoing list of important factors is not a complete discussion of all potential risks and uncertainties. PMI does not undertake to update any forward-looking statement that it may make from time to time, except in the normal course of its public disclosure obligations.
Non-GAAP Measures, Glossary and Explanatory Notes
Reconciliations of non-GAAP measures in this release to the most directly comparable U.S. GAAP measures can be found in Exhibit 99.2 to the Form 8-K dated October 21, 2026, and here. A glossary of key terms, definitions and explanatory notes is available in the aforementioned Exhibit 99.2 and on the same webpage, where additional financial schedules, as well as adjustments and other calculations have also been made available.
Management reviews net revenues, gross profit, operating companies income, operating income, operating cash flow and earnings per share, or “EPS,” on an adjusted basis, which may exclude the impact of currency and other items such as acquisitions, divestitures, restructuring costs, tax items and other adjusting items. Additionally, starting in 2022 and on a comparative basis, for these measures other than net revenues and operating cash flow, PMI includes adjustments to add back amortization expense on acquisition related intangible assets that are recorded as part of purchase accounting and contribute to PMI’s revenue generation, as well as impairment of intangible assets, if any. While amortization expense on acquisition related intangible assets is excluded in these adjusted measures, the net revenues generated from these acquired intangible assets are included in the company’s adjusted measures, unless otherwise stated. Currency-neutral and organic growth rates reflect the way management views underlying performance for these measures. PMI believes that such measures provide useful insight into underlying business trends and results. Management reviews these measures because they exclude changes in currency exchange rates and other factors that may distort underlying business trends, thereby improving the comparability of PMI’s business performance between reporting periods. Furthermore, PMI uses several of these measures in its management compensation program to promote internal fairness and a disciplined assessment of performance against company targets. PMI discloses these measures to enable investors to view the business through the eyes of management.
Non-GAAP measures used in this release should neither be considered in isolation nor as a substitute for the financial measures prepared in accordance with U.S. GAAP.
 View original content to download multimedia:https://www.prnewswire.com/in/news-releases/philip-morris-international-reports-2026-third-quarter–first-nine-months-results-and-updates-2026-full-year-adjusted-diluted-eps-forecast-for-currency-only-302918215.html

23, Oct 2026
Philip Morris International Reports 2026 Third-Quarter & First Nine-Months Results and Updates 2026 Full-Year Adjusted Diluted EPS Forecast for Currency Only
Third-Quarter Reported Diluted EPS declined by 4.9% to $2.12;
Adjusted Diluted EPS grew by 5.4% to $2.36; and by 5.8% excluding currency
STAMFORD, Conn. and NEW DELHI, Oct. 23, 2026 /PRNewswire/ — Philip Morris International Inc. (PMI) (NYSE: PM) today announces its 2026 third-quarter results.1
“We delivered another excellent quarter, with growing total volumes, double-digit organic operating income growth and robust margin expansion,” said Jacek Olczak, Group CEO, PMI.
“With continued strong offtake momentum for our smoke-free brands and the exceptional results of our combustible business, we are in a strong position to continue delivering best-in-class performance, and firmly on track for a sixth consecutive year of volume growth.”
1 Explanation of PMI’s use of non-GAAP measures cited in this document and reconciliations to the most directly comparable U.S. GAAP measures can be found in the “Non-GAAP Measures, Glossary and Explanatory Notes” section of this release, in Exhibit 99.2 to the company’s Form 8-K dated October 21, 2026, and here.
Results Highlights – Third Quarter 2026
Shipments increased by 0.6% in the quarter, driven by a 2.7% increase in smoke-free products (SFP), with shipment growth across all categories, supported by high single-digit growth in SFP adjusted in-market sales (IMS), which is the closest proxy to consumer offtake. This was complemented by the continuing resilience of the combustible segment, notably in markets where SFPs are banned or have a limited market presence.
Net revenues increased by 5.5% (7.1% organically) to $11.4 billion, with growth across both smoke-free (up by 4.1%, 6.3% organically) and combustibles (up by 6.4%, 7.7% organically). Our smoke-free business accounted for more than 40% of total net revenues in the third quarter, and around 42% on a year-to-date basis, with more than 30 markets above 50%. PMI smoke-free products are now available in 110 markets.
Gross profit increased by 6.7% (8.3% organically), expanding gross margins through strong combustible pricing, scale and SFP mix benefits. Operating income increased by 14.1% (10.5% organically), reflecting the underlying strength of the business. This strong financial performance represents a new record quarterly high of net revenue, gross profit and operating income for the group.
Reported diluted EPS of $2.12 declined by 4.9%, mainly due to the non-cash fair value adjustment for equity security investments. Adjusted diluted EPS grew by 5.4%, or by 5.8% excluding a one cent unfavorable currency impact to reach $2.36, another quarterly all-time high.
International Smoke-Free Segment
Net revenue growth of 0.7% (3.4% organically) was driven by 2.7% volume growth, against the backdrop of a challenging HTU comparison due to the phasing of shipments between periods, notably in Japan. Strong adjusted IMS momentum continued, with an acceleration to 8.0% growth. Gross profit grew by 0.8% (3.3% organically).
Heat-not-burn SFP: IQOS continued to lead the growth of the global category, in which PMI holds around three-quarters of HTU volume share. IQOS HTUs gained 1.0pp to reach 9.9% of combined cigarette and HTU industry volumes in markets where present and grew shipment volumes by 1.5% to 41.5 billion units, at the high end of our previously disclosed expectations. HTU adjusted IMS grew by 7.1%. Excluding Japan and Poland, adjusted IMS continued to grow in the double digits, increasing by 10%, reflecting broad-based growth across a variety of markets, underscoring the increasing geographic diversification of IQOS.
- In Japan, PMI HTU adjusted IMS grew by 3.4%, or by 1.3% excluding the estimated consumer pantry-loading impact ahead of the October 1 excise-driven price increase (JPY20 per pack). This continues to be broadly in line with our expectations as consumers adjust following the first excise-driven price increase (JPY40 per pack) on April 1. IQOS maintained a strong category share at 68%, with SENTIA continuing to play a key role in capturing price-sensitive TEREA consumers.
- In Europe, IQOS HTU adjusted IMS growth strengthened to an estimated 6.0%, notwithstanding ongoing disruptions in Ukraine and the continued impact of the characterizing flavor ban in Poland. IQOS HTU adjusted market share increased by 0.9pp to 11.6%. This growth was led by strong performance in many markets, notably Germany, Greece, Spain and Romania. Adjusted IMS in Italy continued its strong growth trajectory, underscoring the category’s significant potential across the region. Excluding Poland, adjusted IMS volumes grew by around 8%.
- Outside Europe and Japan, adjusted IMS grew by 12.7% and offtake share increased in key cities across the globe, including Riyadh, Kuala Lumpur, Mexico City, Jakarta and Taipei, underlining the global growth potential of the heat-not-burn category.
Oral SFP: Total oral SFP volumes turned positive, increasing by 0.5%, as growth in modern oral of 20.6% to 0.5 billion pouches more than offset declines in the legacy Nordic snus business. We continue to expand ZYN‘s footprint, with ZYN now available in 62 international markets and showing promising growth in geographies such as Global Travel Retail, Poland, and the Philippines, as well as sequential improvements in Sweden.
E-vapor SFP: We continue to drive outstanding growth in VEEV, with quarterly shipments up by 61.6%. VEEV further reinforced its leadership position in Europe, with strong growth across a range of markets, notably Romania, Greece, France and Spain. VEEV is also demonstrating promising results in markets outside of Europe, such as Indonesia, Global Travel Retail, Egypt, Malaysia and South Korea following the launch in August. PMI remains committed to building and commercializing the brand in a focused, responsible and profitable manner, leveraging its key role as part of our multicategory portfolio.
International Combustibles Segment
The combustibles segment delivered an exceptional quarter, with cigarette volume continuing to show strong resilience with broadly flat shipments. This was notably due to strong growth in markets such as Turkey, Indonesia and Egypt, which offset declines in other markets. Net revenues grew by 6.5% (7.8% organically), driven by another impressive quarter of 8.9% pricing, partly offset by geographic mix. This quarter also benefited from the favorable restructuring of distribution terms in certain markets, which is not expected to recur at the same level in future quarters. Gross profit grew by 8.6% (9.8% organically). Our cigarette category volume share stood at 25.9% (up by 0.4pp) despite adverse market mix. Marlboro continued to gain share (up by 0.5pp) reaching a record category share of 11.4%.
U.S. Segment
In the U.S., total ZYN shipments grew by 4.2% to 3.2 billion pouches, despite challenging comparisons against a special promotional campaign last year and supported by the ongoing launches of ZYN ULTRA, new flagship dry flavors, 1.5mg and 8mg flagship variants. These portfolio extensions enable ZYN to cover a broader range of consumer preferences and compete in the most dynamic growing segments of the category. Segment net revenues grew by 22.7% and gross profit by 24.2% (23.8% organically), driven by volume growth combined with favorable pricing comparisons due to prior year promotional activities. Operating companies income decreased by 3.3% (increased by 1.5% organically), including a significant increase in commercial investments to support the expansion of our ZYN portfolio, which increased its category share by over 100 basis points between June and September, as estimated by Nielsen.
As part of our previously announced plans to accelerate investments in the second half, and with distribution of the extended range of ZYN products continuing to progress, we plan to further increase investments to support the brand in the fourth quarter. This reflects a ramp-up in consumer communications, notably an expansion of the ‘When It Clicks‘ brand campaign, and the transition of the majority of the ZYN flagship portfolio to 20-pouch cans (from 15-pouch cans today), including associated transitional support programs. The change to 20-pouch cans is designed to align the value proposition across the portfolio and optimize ZYN’s price premium to support future growth in the dynamic U.S. nicotine pouch category.
On August 21, the FDA granted PMTA authorization to 11 variants of ZYN ULTRA, our higher-nicotine moist offering. ZYN now has PMTA authorization of 31 variants in total, more than any other nicotine brand on the market. This, combined with the MRTP authorization of 20 ZYN flagship variants on June 30, underlines the robustness of the science behind our products and their potential to reduce the harm caused by smoking.
Dividend: Increased regular quarterly dividend by 8.8% to $1.60 per share, or an annualized $6.40 per share.
|
Third-Quarter 2026 Performance Highlights |
||||||||||||||||
|
Shipment Volume |
PMI |
International |
International |
U.S. |
||||||||||||
|
Q3 |
vs. PY |
Q3 |
vs. PY |
Q3 |
vs. PY |
Q3 |
vs. PY |
|||||||||
|
Total |
206.2 |
0.60 % |
44.5 |
2.70 % |
158.0 |
— % |
3.7 |
2.30 % |
||||||||
|
Cigarettes |
158.0 |
— % |
158.0 |
— % |
||||||||||||
|
SFP |
48.2 |
2.70 % |
44.5 |
2.70 % |
3.7 |
2.30 % |
||||||||||
|
HTU |
41.5 |
1.50 % |
41.5 |
1.50 % |
– |
(14.30) % |
||||||||||
|
Oral SFP |
5.3 |
1.80 % |
1.6 |
0.50 % |
3.7 |
2.30 % |
||||||||||
|
E-Vapor |
1.4 |
61.60 % |
1.4 |
61.60 % |
||||||||||||
|
“-” indicates zero volumes or less than 50 million units |
||||||||||||||||
|
PMI |
International |
International |
U.S. |
|||||||||||||
|
Net Revenues ($ bn) |
$11.4 |
$3.9 |
$6.7 |
$0.8 |
||||||||||||
|
reported vs. Q3 2025 |
5.50 % |
0.70 % |
6.50 % |
22.70 % |
||||||||||||
|
organic vs. Q3 2025 |
7.10 % |
3.40 % |
7.80 % |
22.70 % |
||||||||||||
|
Gross Profit ($ bn) |
$7.9 |
$2.7 |
$4.6 |
$0.5 |
||||||||||||
|
reported vs. Q3 2025 |
6.70 % |
0.80 % |
8.60 % |
24.20 % |
||||||||||||
|
organic vs. Q3 2025 |
8.30 % |
3.30 % |
9.80 % |
23.80 % |
||||||||||||
|
OCI ($ bn) |
$4.9 |
$4.9 |
$— |
|||||||||||||
|
reported vs. Q3 2025 |
13.00 % |
12.90 % |
(3.30) % |
|||||||||||||
|
organic vs. Q3 2025 |
10.50 % |
10.80 % |
1.50 % |
|||||||||||||
|
Operating Income ($ bn) |
$4.9 |
|||||||||||||||
|
reported vs. Q3 2025 |
14.10 % |
|||||||||||||||
|
organic vs. Q3 2025 |
10.50 % |
|||||||||||||||
|
Note: Sums might not foot to total due to rounding. |
||||||||||||||||
|
2026 |
2025 |
Change |
||||||||||||||
|
Reported Diluted EPS |
$2.12 |
$2.23 |
(4.90) % |
|||||||||||||
|
Amortization of intangibles |
0.13 |
0.13 |
||||||||||||||
|
Fair value adjustment for equity security investments |
0.06 |
(0.07) |
||||||||||||||
|
Income tax impact associated with Swedish Match AB financing |
0.01 |
– |
||||||||||||||
|
Dutch pension plan buy-out loss |
0.04 |
– |
||||||||||||||
|
Germany excise tax classification litigation charge |
– |
0.1 |
||||||||||||||
|
RBH (Canada) Plan Implementation, including dividend income, net |
– |
(0.10) |
||||||||||||||
|
Impairment of Wellness business related equity investment |
– |
0.09 |
||||||||||||||
|
Tax items |
– |
(0.14) |
||||||||||||||
|
Adjusted Diluted EPS |
$2.360 |
$2.24 |
5.40 % |
|||||||||||||
|
Less: Currency |
(0.01) |
|||||||||||||||
|
Adjusted Diluted EPS, excluding Currency |
$2.37 |
$2.24 |
5.80 % |
|||||||||||||
|
First Nine-Months 2026 Performance Highlights |
||||||||||||||||
|
Shipment Volume (billion equivalent units) |
PMI |
International |
International |
U.S. |
||||||||||||
|
YTD |
vs. PY |
YTD |
vs. PY |
YTD |
vs. PY |
YTD |
vs. PY |
|||||||||
|
Total |
595.6 |
0.50 % |
133.3 |
7.40 % |
452.2 |
(1.20) % |
10.1 |
(5.80) % |
||||||||
|
Cigarettes |
452.2 |
(1.20) % |
452.2 |
(1.20) % |
||||||||||||
|
SFP |
143.4 |
6.40 % |
133.3 |
7.40 % |
10.1 |
(5.80) % |
||||||||||
|
HTU |
124.5 |
6.70 % |
124.5 |
6.70 % |
– |
+100 % |
||||||||||
|
Oral SFP |
14.9 |
(5.30) % |
4.8 |
(4.00) % |
10.0 |
(5.80) % |
||||||||||
|
E-Vapor |
4.0 |
68.10 % |
4.0 |
68.10 % |
||||||||||||
|
“-” indicates zero volumes or less than 50 million units |
||||||||||||||||
|
PMI |
International |
International |
U.S. |
|||||||||||||
|
Net Revenues ($ bn) |
$32.8 |
$11.6 |
$18.9 |
$2.3 |
||||||||||||
|
reported vs. YTD 2025 |
8.20 % |
12.30 % |
7.70 % |
(5.20) % |
||||||||||||
|
organic vs. YTD 2025 |
5.90 % |
9.90 % |
5.20 % |
(5.50) % |
||||||||||||
|
Gross Profit ($ bn) |
$22.4 |
$8.1 |
$12.8 |
$1.5 |
||||||||||||
|
reported vs. YTD 2025 |
9.40 % |
14.30 % |
9.90 % |
(14.80) % |
||||||||||||
|
organic vs. YTD 2025 |
7.10 % |
11.80 % |
7.40 % |
(14.60) % |
||||||||||||
|
OCI ($ bn) |
$13.6 |
$13.7 |
$(0.1) |
|||||||||||||
|
reported vs. YTD 2025 |
13.40 % |
17.60 % |
-(100) % |
|||||||||||||
|
organic vs. YTD 2025 |
7.60 % |
11.40 % |
(41.10) % |
|||||||||||||
|
Operating Income ($ bn) |
$13.3 |
|||||||||||||||
|
reported vs. YTD 2025 |
15.40 % |
|||||||||||||||
|
organic vs. YTD 2025 |
7.70 % |
|||||||||||||||
|
Note: Sums might not foot to total due to rounding. |
||||||||||||||||
|
2026 |
2025 |
Change |
||||||||||||||
|
Reported Diluted EPS |
$5.48 |
$5.89 |
(7.00) % |
|||||||||||||
|
Amortization of intangibles |
0.37 |
0.37 |
||||||||||||||
|
Fair value adjustment for equity security investments |
0.22 |
(0.33) |
||||||||||||||
|
Restructuring charges |
0.02 |
0.13 |
||||||||||||||
|
Income tax impact associated with Swedish Match AB financing |
0.07 |
(0.24) |
||||||||||||||
|
Impairment related to the RBH equity investment |
0.33 |
– |
||||||||||||||
|
Egypt sales tax settlement adjustment |
(0.01) |
– |
||||||||||||||
|
Dutch pension plan buy-out loss |
0.04 |
– |
||||||||||||||
|
Impairment of goodwill |
– |
0.03 |
||||||||||||||
|
Germany excise tax classification litigation charge |
– |
0.1 |
||||||||||||||
|
RBH (Canada) Plan Implementation, including dividend income, net |
– |
(0.10) |
||||||||||||||
|
Impairment of Wellness business related equity investment |
– |
0.09 |
||||||||||||||
|
Tax items |
– |
(0.11) |
||||||||||||||
|
Adjusted Diluted EPS |
$6.52 |
$5.83 |
11.80 % |
|||||||||||||
|
Less: Currency |
0.2 |
|||||||||||||||
|
Adjusted Diluted EPS, excluding Currency |
$6.32 |
$5.83 |
8.40 % |
|||||||||||||
Impact of Geopolitical Conflicts
While the impact of the ongoing Middle East conflict on the group remains manageable, it has had an increasing effect on our business, with energy-related inflation driving incremental cost pressures in the third quarter. In our full-year forecast, we assume the observed rise in energy-related input prices to have a slightly higher impact in the fourth quarter, as a larger proportion of input price increases take effect. The long-term situation remains unpredictable, and it is difficult to assess the broader implications for consumers or the global cost environment.
In addition, the evolution of the situation in Ukraine has caused certain disruptions to our business this year, including the impact of strikes on our supply chain and logistics infrastructure in certain locations. We expect this disruption to have an impact on our operating income this year.
|
2026 Full-Year Forecast |
||||||
|
2026 |
2025 |
Growth |
||||
|
Reported Diluted EPS |
$7.11 – $7.26 |
$ 7.26 |
||||
|
Adjustments |
||||||
|
Amortization of intangibles |
0.50 |
0.50 |
||||
|
Fair value adjustment for equity security investments |
0.22 |
(0.18) |
||||
|
Restructuring charges |
0.03 |
0.14 |
||||
|
Income tax impact associated with Swedish Match AB financing |
0.07 |
(0.25) |
||||
|
Impairment related to the RBH equity investment |
0.33 |
— |
||||
|
Egypt sales tax settlement adjustment |
(0.01) |
— |
||||
|
Dutch pension plan buy-out loss |
0.04 |
— |
||||
|
Other 2025 adjustments(1) |
— |
0.07 |
||||
|
Total Adjustments |
1.18 |
0.28 |
||||
|
Adjusted Diluted EPS |
$8.29 – $8.44 |
$ 7.54 |
9.9% – 11.9% |
|||
|
Less: Currency |
0.18 |
|||||
|
Adjusted Diluted EPS, excluding currency |
$8.11 – $8.26 |
$ 7.54 |
7.5% – 9.5% |
|||
|
(1) Includes: $0.10 Germany excise tax classification litigation charge; ($0.10) RBH (Canada) Plan Implementation, including dividend income, net; $0.09 |
||||||
Reported diluted EPS is forecast to be in a range of $7.11 to $7.26, at prevailing exchange rates. Excluding a total 2026 adjustment of $1.18 per share, this forecast represents a projected increase of 9.9% to 11.9% versus adjusted diluted EPS of $7.54 in 2025. This includes a favorable currency impact of $0.18, at prevailing exchange rates (previously $0.24). Excluding currency, this forecast represents a projected increase of 7.5% to 9.5% versus adjusted diluted EPS of $7.54 in 2025, as outlined in the above table.
2026 Full-Year Forecast Assumptions
- Growing (previously broadly stable to slightly growing) total PMI cigarette and SFP shipment volume, with high single-digit SFP shipment growth, led by high single-digit SFP adjusted IMS growth, and a cigarette shipment volume decline at a similar level to the year-to-date trend (previously around 2% to 3%);
- Net revenue growth of 5% to 7% on an organic basis; with a greater likelihood to be in the middle or upper-half of the range, supported by a fourth-quarter reacceleration in international smoke-free;
- Organic operating income growth of 7% to 9%; with a greater likelihood to be in the middle or lower-half of the range, with a corresponding flow through to our EPS forecast range, given the cost impacts of ongoing geopolitical tensions and the previously communicated step-up in U.S. growth investments;
- Full-year amortization of acquired intangibles of $0.50 per share;
- Broadly stable net financing costs;
- An effective tax rate, excluding discrete tax events, of around 21.5%;
- Operating cash flow around $13.5 billion at prevailing exchange rates, subject to year-end working capital requirements;
- Capital expenditures of $1.4 to $1.6 billion, predominantly supporting the smoke-free business;
- Further net debt to adjusted EBITDA ratio improvement as we target a ratio of close to 2.0x by the end of 2026, at prevailing exchange rates; and
- No share repurchases.
Factors described in the Forward-Looking and Cautionary Statements section of this release represent continuing risks to these projections.
|
Third-Quarter 2026 Operating Review |
||||||||
|
Net Revenues |
PMI |
International |
International |
U.S. |
||||
|
2025 |
$10,845 |
$3,839 |
$6,316 |
$689 |
||||
|
Price |
739 |
21 |
565 |
153 |
||||
|
Volume/Mix/Other |
36 |
108 |
(75) |
4 |
||||
|
Acquisitions & Divestitures |
(27) |
(27) |
— |
— |
||||
|
Currency |
(155) |
(74) |
(81) |
(1) |
||||
|
2026 |
$11,438 |
$3,867 |
$6,725 |
$845 |
||||
|
vs. Q3 2025 |
5.50 % |
0.7 % |
6.5 % |
22.7 % |
||||
|
Organic growth |
7.10 % |
3.4 % |
7.8 % |
22.7 % |
||||
|
Gross Profit |
PMI |
International |
International |
U.S. |
||||
|
2025 |
$7,361 |
$2,683 |
$4,244 |
$434 |
||||
|
Price |
739 |
21 |
565 |
153 |
||||
|
Volume/Mix/Other |
(23) |
87 |
(99) |
(9) |
||||
|
Cost |
(104) |
(18) |
(48) |
(39) |
||||
|
Acquisitions & Divestitures |
(7) |
(7) |
— |
— |
||||
|
Currency |
(112) |
(60) |
(52) |
— |
||||
|
2026 |
$7,854 |
$2,705 |
$4,610 |
$539 |
||||
|
vs. Q3 2025 |
6.70 % |
0.80 % |
8.60 % |
24.20 % |
||||
|
Adjustments* |
6 |
1 |
— |
5 |
||||
|
2026 Adjusted Gross Profit |
$7,860 |
$2,705 |
$4,610 |
$544 |
||||
|
vs. Q3 2025 |
6.70 % |
0.80 % |
8.60 % |
23.90 % |
||||
|
Organic growth |
8.30 % |
3.30 % |
9.80 % |
23.80 % |
||||
|
2026 Adj. Gross Profit Margin |
68.70 % |
70.00 % |
68.50 % |
64.40 % |
||||
|
vs. Q3 2025 |
0.8pp |
0.1pp |
1.3pp |
0.7pp |
||||
|
Organic growth |
0.8pp |
—pp |
1.3pp |
0.6pp |
||||
|
(*) For a list of adjusting items refer to the “Non-GAAP Measures, Glossary and Explanatory Notes” section of this release, in Exhibit |
||||||||
|
PMI (in millions) |
Variance |
|||||||||||||||||
|
2026 |
2025 |
Change |
Total |
Price |
Volume / |
Cost |
Acq. / |
Currency |
||||||||||
|
Net Revenues |
11,438 |
10,845 |
5.50 % |
593 |
739 |
36 |
– |
(27) |
(155) |
|||||||||
|
Cost of Sales (1) |
(3,584) |
(3,484) |
(2.90) % |
(100) |
– |
(59) |
(104) |
20 |
43 |
|||||||||
|
Gross Profit |
7,854 |
7,361 |
6.70 % |
493 |
739 |
(23) |
(104) |
(7) |
(112) |
|||||||||
|
Marketing, Administration and Research Costs (2) |
(2,993) |
(3,058) |
2.10 % |
65 |
– |
– |
40 |
4 |
21 |
|||||||||
|
Corporate Expenses & Other |
5 |
(40) |
+100 % |
45 |
– |
– |
(7) |
– |
52 |
|||||||||
|
Operating Income |
4,866 |
4,263 |
14.10 % |
603 |
739 |
(23) |
(71) |
(3) |
(39) |
|||||||||
|
Adjustments* |
(251) |
(407) |
38.30 % |
156 |
– |
– |
156 |
– |
– |
|||||||||
|
Adj. Operating Income |
5,117 |
4,670 |
9.60 % |
447 |
739 |
(23) |
(227) |
(3) |
(39) |
|||||||||
|
Adj. OI Margin |
44.70 % |
43.10 % |
1.6pp |
|||||||||||||||
|
(1) Includes $6 million in 2026 and $5 million in 2025 related to the adjusting items shown below Operating Income |
||||||||||||||||||
|
(2) Includes $245 million in 2026 and $402 million in 2025 related to the adjusting items shown below Operating Income |
||||||||||||||||||
|
(*) For a list of adjusting items refer to Exhibit 99.2 to the company’s Form 8-K dated October 21, 2026. |
||||||||||||||||||
|
Note: Sums might not foot to total due to rounding. |
||||||||||||||||||
Total PMI
- Estimated industry volume (excluding China and the U.S.) for cigarettes and HTUs was broadly stable, decreasing by 0.1%.
- Net revenues increased by 7.1% organically, mainly reflecting: a favorable pricing variance driven by international combustibles and the U.S. segment.
- Operating income increased by 10.5% on an organic basis, largely reflecting the same factors as for net revenues.
International Smoke-Free Segment
- Shipment volume grew by 2.7%, with broad-based growth across markets, notably Taiwan, Global Travel Retail, Greece, Germany, and Bulgaria, notwithstanding a challenging HTU comparison due to phasing of shipments between periods.
- Net revenues increased by 3.4% on an organic basis, reflecting: a favorable volume/mix driven by higher HTU and e-vapor volumes and a favorable pricing variance due to HTUs.
- Gross profit increased by 3.3% organically mainly due to the same factors as for net revenues.
International Combustibles Segment
- Shipment volumes were broadly flat with notable increases in Turkey, Indonesia, and Egypt, offsetting declines in markets such as Russia, Poland and Japan.
- Net revenues increased by 7.8% on an organic basis, reflecting: a favorable pricing variance, the restructuring of distribution terms in certain markets, and partially offset by unfavorable geographic mix.
- Gross profit increased by 9.8% organically due to the same factors as for net revenues, slightly offset by higher costs due to increases in energy-related input prices.
U.S. Segment
- Net revenues increased by 22.7%, primarily reflecting: growing ZYN shipments of 4.2%, and a favorable price variance against prior year promotions, supported by growth in the Wellness business and cigars.
- Gross profit increased by 23.8% on an organic basis reflecting the same factors as for net revenues, partly offset by higher manufacturing costs linked to the expansion of our footprint.
- Adjusted OCI increased by 1.5% organically, to $171 million, reflecting the same factors as for adjusted gross profit and the start of increased marketing investments to support the expanded ZYN portfolio.
|
First Nine-Months 2026 Operating Review – Net Revenues |
||||
|
(in millions) |
PMI |
International |
International |
U.S. |
|
2025 |
$30,286 |
$10,310 |
$17,525 |
$2,451 |
|
Price |
1,889 |
195 |
1,607 |
88 |
|
Volume/Mix/Other |
(89) |
823 |
(689) |
(222) |
|
Acquisitions & Divestitures |
(44) |
(44) |
— |
— |
|
Currency |
734 |
297 |
429 |
8 |
|
2026 |
$32,776 |
$11,580 |
$18,872 |
$2,324 |
|
vs. YTD 2025 |
8.2 % |
12.3 % |
7.7 % |
(5.2) % |
|
Organic growth |
5.9 % |
9.9 % |
5.2 % |
(5.5) % |
|
Gross Profit |
PMI |
International |
International |
U.S. |
||||
|
2025 |
$20,497 |
$7,088 |
$11,679 |
$1,729 |
||||
|
Price |
1,889 |
195 |
1,607 |
88 |
||||
|
Volume/Mix/Other |
(261) |
575 |
(621) |
(214) |
||||
|
Cost |
(179) |
65 |
(116) |
(128) |
||||
|
Acquisitions & Divestitures |
(11) |
(11) |
— |
— |
||||
|
Currency |
483 |
194 |
290 |
(1) |
||||
|
2026 |
$22,418 |
$8,105 |
$12,839 |
$1,473 |
||||
|
vs. YTD 2025 |
9.4 % |
14.3 % |
9.9 % |
(14.8) % |
||||
|
Adjustments* |
18 |
2 |
— |
16 |
||||
|
2026 Adjusted Gross Profit |
$22,436 |
$8,107 |
$12,839 |
$1,489 |
||||
|
vs. YTD 2025 |
9.4 % |
14.3 % |
9.9 % |
(14.6) % |
||||
|
Organic growth |
7.1 % |
11.8 % |
7.4 % |
(14.6) % |
||||
|
2026 Adj. Gross Profit Margin |
68.5 % |
70.0 % |
68.0 % |
64.1 % |
||||
|
vs. YTD 2025 |
0.8pp |
1.2pp |
1.4pp |
(7.1)pp |
||||
|
Organic growth |
0.8pp |
1.2pp |
1.4pp |
(6.9)pp |
||||
|
(*) For a list of adjusting items refer to the “Non-GAAP Measures, Glossary and Explanatory Notes” section of this release, in Exhibit |
||||||||
|
PMI (in millions) |
Variance |
|||||||||||||||||
|
2026 |
2025 |
Change |
Total |
Price |
Volume / |
Cost |
Acq. / Divest. |
Currency |
||||||||||
|
Net Revenues |
32,776 |
30,286 |
8.20 % |
2,490 |
1,889 |
(89) |
– |
(44) |
734 |
|||||||||
|
Cost of Sales (1) |
(10,358) |
(9,789) |
(5.80) % |
(569) |
– |
(172) |
(179) |
33 |
(251) |
|||||||||
|
Gross Profit |
22,418 |
20,497 |
9.40 % |
1,921 |
1,889 |
(261) |
(179) |
(11) |
483 |
|||||||||
|
Marketing, Administration and Research Costs (2) |
(8,831) |
(8,474) |
(4.20) % |
(357) |
– |
– |
(76) |
6 |
(287) |
|||||||||
|
Impairment of Goodwill |
— |
(41) |
+100 % |
41 |
– |
– |
41 |
– |
– |
|||||||||
|
Corporate Expenses & Other |
(298) |
(463) |
35.60 % |
165 |
– |
– |
(18) |
– |
183 |
|||||||||
|
Operating Income |
13,289 |
11,519 |
15.40 % |
1,770 |
1,889 |
-261 |
-232 |
-5 |
379 |
|||||||||
|
Adjustments* |
(769) |
(1,187) |
35.20 % |
418 |
– |
– |
418 |
– |
– |
|||||||||
|
Adj. Operating Income |
14,058 |
12,706 |
10.60 % |
1,352 |
1,889 |
(261) |
(650) |
(5) |
379 |
|||||||||
|
Adj. OI Margin |
42.90 % |
42.00 % |
0.9pp |
|||||||||||||||
|
(1) Includes $18 million in 2026 and $16 million in 2025 related to the adjusting items shown below Operating Income |
||||||||||||||||||
|
(2) Includes $751 million in 2026 and $1,130 million in 2025 related to the adjusting items shown below Operating Income |
||||||||||||||||||
|
(*) For a list of adjusting items refer to the “Non-GAAP Measures, Glossary and Explanatory Notes” section of this release, in Exhibit 99.2 to the company’s Form 8-K dated October 21, 2026 |
||||||||||||||||||
|
Note: Sums might not foot to total due to rounding. |
||||||||||||||||||
Total PMI
- Estimated industry volume (excluding China and the U.S.) for cigarettes and HTUs declined by 0.4%.
- Net revenues increased by 5.9% organically, mainly reflecting: a favorable pricing variance mainly driven by international combustibles; higher international smoke-free volumes; partly offset by unfavorable volume/mix, mainly driven by lower international combustibles and U.S. volumes in the first quarter.
- Operating income increased by 7.7% on an organic basis, reflecting the same factors as for net revenues, partially offset by higher marketing, administration and research costs.
International Smoke-Free Segment
- Shipment volume grew by 7.4%, notably due to Taiwan, Greece, Italy, and Global Travel Retail.
- Net revenues increased by 9.9% on an organic basis, reflecting: a favorable volume/mix driven by higher HTU and e-vapor volumes and a favorable pricing variance due to higher HTU pricing.
- Gross profit increased by 11.8% organically mainly due to the same factors as for net revenues, supported by favorable manufacturing efficiencies.
International Combustibles Segment
- Shipment volume declined by 1.2% with notable decreases in Russia, Mexico, and Germany, partly offset by Turkey and Egypt.
- Net revenues increased by 5.2% on an organic basis, reflecting: a favorable pricing variance and the previously mentioned restructuring of distribution terms in certain markets, partially offset by unfavorable volume/mix.
- Gross profit increased by 7.4% organically due to the same factors as for net revenues, and slightly offset by increases in energy-related input prices.
U.S. Segment
- Net revenues decreased by 5.5% organically, reflecting: unfavorable dynamics in the first quarter with ZYN volumes impacted by distributor and trade inventory movements, slightly offset by favorable price comparisons against higher promotional activities in the third quarter last year.
- Gross profit decreased by 14.6% on an organic basis reflecting the same factors as for net revenues and higher manufacturing costs.
- Adjusted OCI decreased by 41.1% organically, to $550 million, reflecting the same factors as for gross profit and increased investments in marketing, administration and research costs.
Conference Call
A conference call hosted by Massimo Andolina, Group Chief Financial Officer, will be webcast at 9:00 a.m., Eastern Time, on October 21, 2026. The webcast can be accessed here. Further market data will be provided in an appendix to the webcast presentation.
Philip Morris International: A Global Smoke-Free Champion
Philip Morris International is a leading international consumer goods company, actively delivering a smoke-free future and evolving its portfolio for the long term to include products outside of the tobacco and nicotine sector. The company’s current product portfolio primarily consists of cigarettes and smoke-free products, including heat-not-burn, nicotine pouch and e-vapor products. Our smoke-free products are available for sale in 110 markets as of September 30, 2026. As of December 31, 2025 PMI estimates they were used by over 43 million legal-age consumers around the world, many of whom have moved away from cigarettes or significantly reduced their consumption. The smoke-free business accounted for more than 40% of PMI’s third-quarter 2026 total net revenues. Since 2008, PMI has invested over $16 billion to develop, scientifically substantiate and commercialize innovative smoke-free products for legal-age adults who would otherwise smoke or use other nicotine-containing consumer products, with the goal of completely ending the sale of cigarettes. This includes the building of world-class scientific assessment capabilities, notably in the areas of pre-clinical systems toxicology, clinical and behavioral research, as well as post-market studies. Following a robust science-based review, the U.S. Food and Drug Administration has authorized the marketing of Swedish Match’s General snus and ZYN nicotine pouches and versions of PMI’s IQOS devices and consumables – the first-ever such authorizations in their respective categories. Versions of IQOS devices and consumables, General snus and 20 ZYN nicotine pouch variants also obtained the first-ever Modified Risk Tobacco Product authorizations from the FDA. With a strong foundation and significant expertise in life sciences, PMI has a long-term ambition to expand into wellness areas. References to “PMI”, “we”, “our” and “us” mean Philip Morris International Inc., and its subsidiaries. For more information, please visit www.pmi.com and www.pmiscience.com.
Forward-Looking and Cautionary Statements
This release contains projections of future results and goals and other forward-looking statements, including statements regarding expected financial or operational performance; capital allocation plans; investment strategies; regulatory outcomes; market expectations; business plans and strategies. Achievement of future results is subject to risks, uncertainties and inaccurate assumptions. In the event that risks or uncertainties materialize, or underlying assumptions prove inaccurate, actual results could vary materially from those contained in such forward-looking statements. Pursuant to the “safe harbor” provisions of the Private Securities Litigation Reform Act of 1995, PMI is identifying important factors that, individually or in the aggregate, could cause actual results and outcomes to differ materially from those contained in any forward-looking statements made by PMI.
PMI’s business risks include: marketing and regulatory restrictions that could reduce our competitiveness, disrupt our SFP commercialization efforts, eliminate our ability to communicate with adult consumers, or ban certain of our products in certain markets or countries; excise tax increases and discriminatory tax structures; health concerns relating to the use of tobacco and other nicotine-containing products; litigation related to tobacco and/ or nicotine products and intellectual property rights; intense competition; inability to anticipate changes in adult consumer preferences; use and reliance on third-parties; the adverse effects of global and individual country economic, regulatory and political developments, natural disasters and conflicts; geopolitical instability; the impact and consequences of Russia’s invasion of Ukraine; changes in legal-age adult smoker behavior; continued decline of tax-paid cigarettes; lost revenues as a result of counterfeiting, contraband and cross-border purchases; governmental investigations; unfavorable currency exchange rates and currency devaluations, sustained periods of elevated inflation, and limitations on the ability to repatriate funds; adverse changes in applicable corporate tax laws; disruptions in the credit markets or changes to its credit ratings; recent and potential future tariffs imposed by the U.S. and other countries; adverse changes in the cost, availability, and quality of tobacco and other agricultural products and raw materials, as well as product components for its electronic devices; and the integrity of its information systems and effectiveness of its data privacy policies. PMI’s future profitability may also be adversely affected should it be unsuccessful, in key markets or systemically, in its efforts to introduce, commercialize, and grow smoke-free products or if regulation or taxation do not differentiate between such products and cigarettes; if it is unable to successfully introduce new products, and promote brand equity; if there are prolonged disruptions of facilities used to produce its products; if it is unable to enter new markets or improve its margins through increased prices and productivity gains; if other market participants are more successful in their SFP commercialization efforts; if it is unable to attract and retain the best global talent; or if it is unable to successfully integrate and realize the expected benefits from recent transactions and acquisitions. Future results are also subject to the lower predictability of our smoke-free products performance.
PMI is further subject to other risks detailed from time to time in its publicly filed documents, including PMI’s Annual Report on Form 10-K for the fourth quarter and year ended December 31, 2025, and the Quarterly Report on Form 10-Q for the third quarter ended September 30, 2026, which will be filed in the coming days. PMI cautions that the foregoing list of important factors is not a complete discussion of all potential risks and uncertainties. PMI does not undertake to update any forward-looking statement that it may make from time to time, except in the normal course of its public disclosure obligations.
Non-GAAP Measures, Glossary and Explanatory Notes
Reconciliations of non-GAAP measures in this release to the most directly comparable U.S. GAAP measures can be found in Exhibit 99.2 to the Form 8-K dated October 21, 2026, and here. A glossary of key terms, definitions and explanatory notes is available in the aforementioned Exhibit 99.2 and on the same webpage, where additional financial schedules, as well as adjustments and other calculations have also been made available.
Management reviews net revenues, gross profit, operating companies income, operating income, operating cash flow and earnings per share, or “EPS,” on an adjusted basis, which may exclude the impact of currency and other items such as acquisitions, divestitures, restructuring costs, tax items and other adjusting items. Additionally, starting in 2022 and on a comparative basis, for these measures other than net revenues and operating cash flow, PMI includes adjustments to add back amortization expense on acquisition related intangible assets that are recorded as part of purchase accounting and contribute to PMI’s revenue generation, as well as impairment of intangible assets, if any. While amortization expense on acquisition related intangible assets is excluded in these adjusted measures, the net revenues generated from these acquired intangible assets are included in the company’s adjusted measures, unless otherwise stated. Currency-neutral and organic growth rates reflect the way management views underlying performance for these measures. PMI believes that such measures provide useful insight into underlying business trends and results. Management reviews these measures because they exclude changes in currency exchange rates and other factors that may distort underlying business trends, thereby improving the comparability of PMI’s business performance between reporting periods. Furthermore, PMI uses several of these measures in its management compensation program to promote internal fairness and a disciplined assessment of performance against company targets. PMI discloses these measures to enable investors to view the business through the eyes of management.
Non-GAAP measures used in this release should neither be considered in isolation nor as a substitute for the financial measures prepared in accordance with U.S. GAAP.
View original content to download multimedia:https://www.prnewswire.com/in/news-releases/philip-morris-international-reports-2026-third-quarter–first-nine-months-results-and-updates-2026-full-year-adjusted-diluted-eps-forecast-for-currency-only-302918215.html
23, Oct 2026
GoDaddy Brings ‘Ink Your Link’ Campaign to NYC: NYSE Content Update
NYSE issues a pre-market daily advisory direct from the trading floor.
NEW YORK, Oct. 23, 2026 /PRNewswire/ — The New York Stock Exchange (NYSE) provides a daily pre-market update directly from the NYSE Trading Floor. Access today’s NYSE Pre-market update for market insights before trading begins.
Kristen Scholer delivers the pre-market update on October 23rd
- GoDaddy to open pop-up in Manhattan for entrepreneurs and consumers this weekend
- It will give small business owners the chance to get temporary tattoos inspired by their work.
- The larger ‘Ink Your Link’ campaign is designed to celebrate the courage and commitment it takes to build a business.
- GoDaddy (NYSE: GDDY) executives will join NYSE Live to provide more details about the campaign’s goals and its focus on small businesses.
- The 29th Annual Wall Street Project Economic Impact Summit takes place today at the NYSE
- ‘The Sports Investment Revolution: From Ownership to Ecosystem’ is the theme for this year’s event.
- It’s being organized by the Rainbow PUSH Coalition and the Citizenship Education Fund.
- NFL Alumni Association CEO Brad Edwards, an event participant, will join NYSE Live to discuss the evolution of athlete entrepreneurship.
- Nova Minerals to celebrate its recent transfer to NYSE American
- Nova says it has evolved from an exploration company into a development-stage resource firm.
- CEO Christopher Gerteisen will join NYSE Live to share the latest details on the Estelle Project in Alaska and highlight his company’s 2027 goals.
Opening Bell
Nova Minerals (NYSE American: NVA) celebrates its listing
Closing Bell
Rainbow PUSH Wall Street Project celebrates its 29th Annual Wall Street Project Economic Impact Summit.
For market insights, IPO activity, and today’s opening bell, download the NYSE TV App and check out the NYSE YouTube: TV.NYSE.com and YouTube.com/@NYSEofficial


 View original content to download multimedia:https://www.prnewswire.co.uk/news-releases/godaddy-brings-ink-your-link-campaign-to-nyc-nyse-content-update-302918091.html

23, Oct 2026
TCL Zhonghuan Powers India’s Energy Transition with PV Innovations at REI Expo 2026
GREATER NOIDA, India, Oct. 23, 2026 /PRNewswire/ — The Renewable Energy India Expo (REI) opened on October 22 at the India Expo Centre in Greater Noida. As one of South Asia’s major renewable energy industry events, this year’s exhibition has attracted companies and industry professionals from around the world. At Booth H16-A275, TCL Zhonghuan showcases a full lineup of high-performance solar products, including high-efficiency silicon wafers, TCL Solar PV modules, and BlueArk energy storage solutions.

India’s PV industry has continued to expand in recent years, with domestic solar cell and module manufacturing capacity growing steadily. Demand from utility-scale solar plants, C&I distributed generation, and residential rooftop installations is driving diverse requirements for upstream materials and end products. Meanwhile, high temperatures and dust in some regions, along with salt-laden coastal environments, place greater demands on the electrical performance, mechanical reliability, and environmental adaptability of PV products. In response to these varied market needs, TCL Zhonghuan is presenting its X-series high-efficiency silicon wafers, alongside TCL Solar PV modules and BlueArk energy storage products, showcasing solutions spanning upstream PV materials through power generation and energy storage.
X-Series Wafers: Supporting High-Efficiency Cell Manufacturing
The X-series wafers are among the key highlights of the portfolio. Through optimizations in crystal growth and related manufacturing processes, the series is designed to control impurity levels and improve material properties, supporting downstream high-efficiency solar cell manufacturing.
Wafer electrical properties and mechanical reliability directly affect cell manufacturing performance and finished-product yields, making them important considerations in material selection. With India’s market increasingly focused on power generation efficiency and project economics, X-series wafers are compatible with mainstream high-efficiency cell technologies, including TOPCon, HJT and xBC, offering cell manufacturers additional options for process optimization and performance improvement.
TCL Solar PV Modules: Designed for Diverse Applications
At the exhibition, TCL Solar is showcasing its T5 Pro and C2 series PV modules. The T5 Pro features high-density encapsulation technology and a three-section cell design, delivering 17% higher power generation than conventional half-cut modules under shading conditions, with a temperature coefficient of -0.26%/°C. The C2 adopts back-contact (BC) technology and a zero-gap design, combining a larger effective power-generating area with low-light performance, shading tolerance, and low degradation. Designed for diverse operating conditions, both series offer solutions for utility-scale, C&I distributed generation, and residential applications. TCL Solar continues to advance BC and TOPCon technologies to meet the evolving needs of the Indian market.
BlueArk Energy Storage: Solutions for Residential, Microgrid and C&I Applications
The BlueArk energy storage series is also on display, covering residential and small commercial use, off-grid and microgrid systems, and C&I applications. The BlueArk X1 features an integrated design for homes and small businesses, while the X5 supports coordinated operation with PV systems and diesel generators for remote areas and industrial parks. The W10 adopts liquid cooling and AI-powered early-warning capabilities to meet C&I energy management needs. Together, the series offers flexible storage solutions to improve energy utilization, optimize electricity costs, and support more reliable power supply across diverse applications.
Strengthening Industry Collaboration and Exploring India’s Solar and Storage Opportunities
As the global energy transition advances, India’s PV industry is seeing new opportunities in both manufacturing capacity development and market expansion. Innovation in upstream materials and stronger value-chain collaboration will also play an important role in supporting the industry’s long-term development.
TCL Zhonghuan will continue to advance silicon wafer technology and product innovation while deepening technical exchanges and business collaboration with partners across the PV value chain, contributing to the global energy transition and a more sustainable, low-carbon future.
 View original content to download multimedia:https://www.prnewswire.co.uk/news-releases/tcl-zhonghuan-powers-indias-energy-transition-with-pv-innovations-at-rei-expo-2026-302918175.html