


27, Oct 2026
ROYAL CARIBBEAN GROUP REPORTS THIRD QUARTER RESULTS ABOVE EXPECTATIONS AND RAISES FULL YEAR GUIDANCE
MIAMI, Oct. 27, 2026 /PRNewswire/ — Royal Caribbean Group (NYSE: RCL) today reported third quarter Earnings per Share (“EPS”) of $6.45 and Adjusted EPS of $6.57. These results were better than the company’s guidance, driven by strong close-in demand and lower costs due to timing. The company now expects full year Adjusted EPS to be in the range of $17.85 to $17.95. The increase in earnings expectations reflects the stronger-than-expected third quarter performance partially offset by higher than anticipated fuel costs (based on current at-the-pump rates) and currency exchange rates.

“Our third quarter results reflect continued strong consumer demand for our vacation experiences and the accelerated momentum across our industry leading brands,” said Jason Liberty, Chairman and CEO, Royal Caribbean Group. “Our strategy to turn the vacation of a lifetime into a lifetime of vacations is propelling our business by leveraging our leading brands, differentiated experiences, loyalty platform and technology capabilities to deepen guest relationships, increase vacation frequency and capture a greater share of the growing global vacation market. Taking further advantage of our leading vacation platform, the recently announced partnership with Sandals and Beaches Resorts is intended to drive significant shareholder value as we expand our vacation ecosystem, giving guests more ways to vacation with us across more occasions.”
“Demand for our leading vacation experiences remains strong, and while it is still early, 2027 bookings are pacing ahead of historical levels at higher rates,” Liberty continued. “2027 also marks the final year of our Perfecta target period. The underlying business is performing well ahead of our initial expectations, and based on the forward fuel curve, we remain on track to achieve our Perfecta goals of delivering 20% Adjusted EPS CAGR from 2024 through 2027, or a $20-handle in 2027. We are currently already above our ROIC target.”
Third Quarter 2026:
- Total revenue was $5.6 billion, a 9% increase year over year. Load factor in the third quarter was 112%.
- Gross Margin Yields decreased 0.8% as-reported. Net Yields increased 0.9% as-reported and 0.6% in Constant Currency, driven by better-than-expected close-in demand in Europe and the Caribbean.
- Gross Cruise Costs per Available Passenger Cruise Days (“APCD”) decreased 0.7% as-reported. Net Cruise Costs (“NCC”), excluding Fuel, per APCD decreased 1.9% as-reported and 1.8% in Constant Currency, due to the timing of expenses that shifted into the fourth quarter.
- Net Income was $1.7 billion or $6.45 per share, Adjusted Net Income was $1.8 billion or $6.57 per share, and Adjusted EBITDA was $2.5 billion.
Full Year 2026 Outlook:
- Revenue is expected to grow 9% year over year. Net Yields are expected to increase approximately 2.7% as-reported and approximately 2.1% in Constant Currency.
- NCC, excluding Fuel, per APCD are expected to increase approximately 0.4% as-reported and be approximately flat in Constant Currency.
- Adjusted EPS is expected to be in the range of $17.85 to $17.95.
Sandals and Beaches Resorts Partnership
In September, Royal Caribbean Group announced an agreement to acquire a 50% interest in Sandals and Beaches Resorts, expanding the company’s vacation platform into the all-inclusive resort category. The Sandals and Beaches Resorts’ portfolio includes 18 resorts across the Caribbean and three resorts under development. It also includes over 1,000 acres of undeveloped land in the Caribbean, including acreage adjacent to existing resorts, creating a meaningful runway for continued growth.
Sandals and Beaches are leading brands in the all-inclusive resort category, with high brand awareness, strong guest satisfaction and a loyal customer base. The portfolio has benefited from significant investment in recent years, including physical upgrades across the resorts and continued enhancements to the guest experience. The partnership will preserve the identity, operating leadership, and Caribbean character of the brands, while providing additional resources and capabilities to support continued value creation. Approximately 30% of Royal Caribbean Group guests also take all-inclusive vacations, while a similar percentage of Sandals and Beaches guests also cruise, creating a significant opportunity to introduce each portfolio to new guests and capture a greater share of the vacations they already take.
“Our mission is to deliver the best vacation experiences responsibly. Sandals and Beaches Resorts extend our platform into an attractive adjacent category, unlocking more ways to deliver on that mission,” said Jason Liberty, Chairman and CEO, Royal Caribbean Group. “Underpinned by the strength and significant growth opportunities of our core business, this investment accelerates our strategy to capture a greater share of the rapidly growing vacation market. By bringing together Sandals and Beaches’ hospitality and Caribbean expertise with our global commercial reach, loyalty and technology capabilities, we see meaningful opportunities to reach new guests, increase vacation frequency, and leverage our combined scale to create additional synergies and value over time.”
The investment is expected to close in early 2027, subject to customary closing conditions and regulatory approvals. The company’s share of earnings from Sandals and Beaches Resorts is expected to be immediately accretive, with contribution in 2027 dependent on the timing of the transaction close. The investment is expected to be accounted for under the equity method, with results reported on a one-quarter lag. The expected contribution from Sandals and Beaches Resorts will be incorporated into the company’s 2027 guidance, along with related detail, upon closing.
Third Quarter 2026 Results
Net Income for the third quarter of 2026 was $1.7 billion or $6.45 per share compared to Net Income of $1.6 billion or $5.74 per share for the same period in the prior year. Adjusted Net Income was $1.8 billion or $6.57 per share for the third quarter of 2026 compared to Adjusted Net Income of $1.6 billion or $5.75 per share for the same period in the prior year. The company also reported total revenues of $5.6 billion and Adjusted EBITDA of $2.5 billion.
Capacity for the third quarter was up 8% year over year and the company delivered memorable vacations to 2.7 million guests, a 9% increase year over year. Total revenue increased 9% year over year. Gross Margin Yields decreased 0.8% as-reported, and Net Yields increased 0.9% as-reported (0.6% in Constant Currency), when compared to the third quarter of 2025. Load factor for the quarter was 112%. Net Yield growth exceeded the company’s guidance primarily driven by better than expected close-in demand in Europe and the Caribbean.
Gross Cruise Costs per APCD decreased 0.7% as-reported, compared to the third quarter of 2025. NCC, excluding Fuel, per APCD decreased 1.9% as-reported (and decreased 1.8% in Constant Currency), when compared to the third quarter of 2025. The better-than-expected cost performance in the third quarter was due to the timing of expenses that shifted into the fourth quarter.
Demand, Bookings and Vacation Platform
Since the last earnings call, booking volumes have increased in the mid-teens across all major channels, with bookings for 2027 sailings up in the high teens, demonstrating strong demand as booking activity builds for 2027.
The company continues to see strong engagement across the vacation journey. Third quarter pre-cruise and onboard revenue rates were ahead of prior year, and fourth quarter pre-cruise revenue rates are also booked ahead of last year. The company’s expanding range of products and services, together with its technology capabilities, is enabling more relevant and personalized engagement by connecting guests with the right experiences at the right time.
Fourth Quarter 2026
In line with the company’s prior expectation, Net Yields are expected to be 4.4% to 4.9% as-reported and 4.2% to 4.7% in Constant Currency as compared to 2025. Net Yield growth is driven by strong demand, a more favorable year-over-year comparison, deployment mix, and the timing of dry docks. Total revenue is expected to grow 9%.
NCC, excluding Fuel, per APCD is expected to decrease 1.5% to 1.0% as-reported and 1.4% to 0.9% in Constant Currency as compared to 2025.
Based on current fuel pricing, interest rates, currency exchange rates and the factors detailed above, the company expects fourth quarter Adjusted EPS to be in the range of $3.48 to $3.58.
Fuel Expense
Bunker pricing, net of hedging, for the third quarter was $778 per metric ton and consumption was 446,000 metric tons.
The company does not forecast fuel prices and its fuel cost calculations are based on current at-the-pump prices, net of hedging impacts. Based on current fuel prices, the company has included $379 million of fuel expense in its fourth quarter guidance, which is 58% hedged via swaps at a forecasted consumption of 463,000 metric tons.
Forecasted consumption is 58%, 53%, 29%, and 14% hedged via swaps for 2026, 2027, 2028, and 2029 respectively. The annual average cost per metric ton of the hedge portfolio is approximately $471, $405, $424, and $451 for 2026, 2027, 2028, and 2029 respectively.
The company provided the following guidance for the fourth quarter and full year 2026:
|
FUEL STATISTICS |
Fourth Quarter 2026 |
Full Year 2026 |
|
Fuel Consumption (metric tons) |
463,000 |
1,763,000 |
|
Fuel Expenses |
$379 million |
$1,345 million |
|
Fourth Quarter 2026 |
Remainder of Year 2026 |
|
|
Percent Hedged (fwd. consumption) |
58.0 % |
58.0 % |
|
GUIDANCE |
As-Reported |
Constant Currency |
|
Fourth Quarter 2026 |
||
|
Net Yields vs. 2025 |
4.4% to 4.9% |
4.2% to 4.7% |
|
Net Cruise Costs per APCD vs. 2025 |
1.9% to 2.4% |
2.0% to 2.5% |
|
Net Cruise Costs per APCD ex. Fuel vs. 2025 |
(1.5%) to (1.0%) |
(1.4%) to (0.9%) |
|
Full Year 2026 |
||
|
Net Yields vs. 2025 |
Approximately 2.7% |
Approximately 2.1% |
|
Net Cruise Costs per APCD vs. 2025 |
Approximately 1.8% |
Approximately 1.5% |
|
Net Cruise Costs per APCD ex. Fuel vs. 2025 |
Approximately 0.4% |
Approximately Flat |
|
GUIDANCE |
Fourth Quarter 2026 |
Full Year 2026 |
|
APCDs |
14.7 million |
56.8 million |
|
Capacity change vs. 2025 |
5.0 % |
6.6 % |
|
Depreciation and amortization |
$460 to $470 million |
$1,870 to $1,890 million |
|
Net Interest, excluding loss on extinguishment of debt |
$255 to $265 million |
$995 to $1,005 million |
|
Adjusted EPS |
$3.48 to $3.58 |
$17.85 to $17.95 |
|
SENSITIVITY |
Fourth Quarter 2026 |
Full Year 2026 |
|
1% Change in Net Yields |
$37 million |
$155 million |
|
1% Change in NCC excluding Fuel |
$19 million |
$73 million |
|
Fourth Quarter 2026 |
Remainder of Year 2026 |
|
|
1% Change in Currency |
$6 million |
$6 million |
|
10% Change in Fuel prices |
$15 million |
$15 million |
|
100 basis pt. Change in SOFR |
$0.3 million |
$0.3 million |
|
Exchange rates used in guidance calculations |
||
|
GBP |
$1.32 |
|
|
AUD |
$0.70 |
|
|
CAD |
$0.70 |
|
|
EUR |
$1.12 |
|
Liquidity
As of September 30, 2026, the company’s liquidity position was $7.4 billion, which includes cash and cash equivalents and undrawn revolving credit facility capacity. During the quarter, the company issued $1.25 billion of 5.550% senior unsecured notes due 2034. The proceeds were used to repay a portion of the company’s floating-rate term loan facilities and debt maturing in 2027.
In October, the company entered into a $400 million delayed-draw term loan with Export Development Canada (EDC), Canada’s export credit agency, representing a new source of capital. The facility includes terms and covenants that are generally consistent with the company’s existing revolving credit facility. In addition, the company increased its revolving credit facility by $50 million, for a total capacity of $6.65 billion.
The company noted that as of September 30, 2026, the scheduled debt maturities for 2026, 2027, 2028, 2029 and 2030 were $0.6 billion, $2.4 billion, $3.2 billion, $1.1 billion, and $1.1 billion respectively.
Capital Expenditures and Capacity Guidance
Capital expenditures for the full year 2026 are expected to be approximately $4.6 billion, based on current foreign exchange rates, and are predominantly related to the company’s new ship order book and land-based destination initiatives. Non-new ship related capital expenditures are expected to be $1.5 billion.
Capacity changes for 2026 are expected to be 6.6% compared to 2025. Capacity changes for 2027, 2028, and 2029 are expected to be approximately 4.5%, 6.0%, and 6.5%, respectively. These figures do not include potential ship sales or additions that the company may elect in the future.
Conference call scheduled
The company has scheduled a conference call at 10 a.m. Eastern Time today. This call can be heard, either live or on a delayed basis, on the company’s investor relations website at www.rclinvestor.com.
Definitions
Selected Operational and Financial Metrics
Adjusted Earnings per Share (“Adjusted EPS”) is a non-GAAP measure that represents Adjusted Net Income attributable to Royal Caribbean Cruises Ltd. (as defined below) divided by basic weighted average shares outstanding or by diluted weighted average shares outstanding, as applicable. We believe that this non-GAAP measure is meaningful when assessing our performance on a comparative basis.
Adjusted EBITDA is a non-GAAP measure that represents EBITDA (as defined below) excluding certain items that we believe adjusting for is meaningful when assessing our profitability on a comparative basis. For the periods presented, these items included (i) other (income) expense; (ii) restructuring charges and other initiative expenses; and (iii) equity investment impairment, (recovery) of losses and other.
Adjusted EBITDA Margin is a non-GAAP measure that represents Adjusted EBITDA (as defined above) divided by total revenues.
Adjusted Gross Margin represents Gross Margin, adjusted for payroll and related, food, fuel, other operating, and depreciation and amortization expenses. Gross Margin is calculated pursuant to GAAP as total revenues less total cruise operating expenses, and depreciation and amortization expenses.
Adjusted Net Income attributable to Royal Caribbean Cruises Ltd. is a non-GAAP measure that represents Net Income attributable to Royal Caribbean Cruises Ltd., excluding certain items that we believe adjusting for is meaningful when assessing our performance on a comparative basis. For the periods presented, these items included (i) loss on extinguishment of debt and inducement expense; (ii) restructuring charges and other initiative expenses; (iii) the amortization of the Silversea intangible assets resulting from the Silversea acquisition; (iv) gain on sale of noncontrolling interest; and (v) equity investment impairment, (recovery) of losses, and other.
Adjusted Operating Income is a non-GAAP measure that represents operating income including income from equity investments and provision for income taxes but excluding certain items for which we believe adjusting for is meaningful when assessing our operating performance on a comparative basis. We use this non-GAAP measure to calculate ROIC (as defined below).
Available Passenger Cruise Days (“APCD”) is our measurement of capacity and represents double occupancy per cabin multiplied by the number of cruise days for the period, which excludes canceled cruise days and cabins not available for sale. We use this measure to perform capacity and rate analysis to identify our main non-capacity drivers that cause our cruise revenue and expenses to vary.
Constant Currency is a significant measure for our revenues and expenses, which are denominated in currencies other than the U.S. Dollar. Because our reporting currency is the U.S. Dollar, the value of these revenues and expenses in U.S. Dollar will be affected by changes in currency exchange rates. Although such changes in local currency prices are just one of many elements impacting our revenues and expenses, it can be an important element. For this reason, we also monitor our revenues and expenses in “Constant Currency” – i.e., as if the current period’s currency exchange rates had remained constant with the comparable prior period’s rates. We calculate “Constant Currency” by applying the average of the prior period exchange rates for each of the corresponding months, of the reported and/or forecasted period, so as to calculate what the results would have been had exchange rates been the same throughout both periods. We do not make predictions about future exchange rates and use current exchange rates for calculations of future periods. It should be emphasized that the use of Constant Currency is primarily used by us for comparing short-term changes and/or projections. Over the longer term, changes in guest sourcing and shifting the amount of purchases between currencies can significantly change the impact of the purely currency-based fluctuations.
EBITDA is a non-GAAP measure that represents Net Income attributable to Royal Caribbean Cruises Ltd. excluding (i) interest income; (ii) interest expense, net of interest capitalized; (iii) depreciation and amortization expenses; and (iv) provision for income taxes. We believe that this non-GAAP measure is meaningful when assessing our operating performance on a comparative basis.
Gross Cruise Costs represent the sum of total cruise operating expenses plus marketing, selling and administrative expenses.
Gross Margin Yield represent Gross Margin per APCD.
Invested Capital represents the most recent five-quarter average of total debt (i.e., Current portion of long-term debt plus Long-term debt) plus the most recent five-quarter average of Total shareholders’ equity. We use this measure to calculate ROIC (as defined below).
Net Cruise Costs and Net Cruise Costs excluding Fuel are non-GAAP measures that represent Gross Cruise Costs excluding commissions, transportation and other expenses, and onboard and other expenses and, in the case of Net Cruise Costs excluding Fuel, fuel expenses. In measuring our ability to control costs in a manner that positively impacts net income, we believe changes in Net Cruise Costs and Net Cruise Costs excluding Fuel to be the most relevant indicators of our cost performance. For the periods presented, Net Cruise Costs and Net Cruise Costs excluding Fuel exclude restructuring charges and other initiative expenses.
Net Yields represent Adjusted Gross Margin per APCD. We utilize Adjusted Gross Margin and Net Yields to manage our business on a day-to-day basis as we believe that they are the most relevant measures of our pricing performance because they reflect the cruise revenues earned by us net of our most significant variable costs, which are commissions, transportation and other expenses, and onboard and other expenses.
Occupancy (“Load factor”), in accordance with cruise vacation industry practice, is calculated by dividing Passenger Cruise Days (as defined below) by APCD. A percentage in excess of 100% indicates that three or more passengers occupied some cabins.
Passenger Cruise Days (“PCD”) represent the number of passengers carried for the period multiplied by the number of days of their respective cruises.
Perfecta Program refers to the multi-year Adjusted EPS and ROIC goals we are seeking to achieve by end of 2027. Under our Perfecta Program, we are targeting 20% compound annual growth rate in Adjusted EPS compared to 2024 and ROIC of 17% or higher by the end of 2027.
Return on Invested Capital (“ROIC”) represents Adjusted Operating Income divided by Invested Capital. We believe ROIC is a meaningful measure because it quantifies how efficiently we generated operating income relative to the capital we have invested in the business.
For additional information see “Adjusted Measures of Financial Performance” below.
About Royal Caribbean Group
Royal Caribbean Group is a leading global vacation company spanning cruise, exclusive destinations, and land-based vacation experiences. The company operates 71 ships sailing to more than 1,000 destinations across all seven continents through its three wholly owned brands – Royal Caribbean, Celebrity Cruises, and Silversea – and a 50% joint venture interest in TUI Cruises which operates the Mein Schiff and Hapag-Lloyd brands.
The Group is expanding its portfolio of private destinations through its Perfect Day and Royal Beach Club collections, and the company will enter river cruising in 2027 with Celebrity River Cruises. Powered by innovative brands, advanced technology, and an industry-leading loyalty program, the company has built a connected vacation ecosystem, turning the vacation of a lifetime into a lifetime of vacations.
Named to the Fortune World’s Most Admired Companies 2026 list and to Forbes’ 2026 Best American Companies lists, Royal Caribbean Group is guided by its mission to deliver the best vacations responsibly. For more information, visit www.royalcaribbeangroup.com.
Cautionary Statement Concerning Forward-Looking Statements
Certain statements in this press release relating to, among other things, our future performance estimates, forecasts and projections constitute forward-looking statements under the Private Securities Litigation Reform Act of 1995. These statements include, but are not limited to: statements regarding the benefits and expected impact of the proposed joint venture with Sandals and Beaches Resorts, including the timing of the closing of the transaction, earnings impact, and anticipated growth, expansion and future opportunities for the joint venture; statements regarding revenues, costs and financial results for 2026 and beyond; anticipated timing for launch of private destinations; our progress toward achievement of our Perfecta program; demand for our brands; expectations on river cruise offerings; future capital expenditures; and expectations regarding our credit profile and fuel expenses. Words such as “anticipate,” “believe,” “committed,” “could,” “driving,” “estimate,” “expect,” “goal,” “intend,” “may,” “plan,” “encouraged,” “project,” “shaping up,” “position,” “allows,” “seek,” “should,” “will,” “would,” “considering,” and similar expressions are intended to help identify forward-looking statements. Forward-looking statements reflect management’s current expectations, are based on judgments, are inherently uncertain and are subject to risks, uncertainties and other factors, which could cause our actual results, performance or achievements to differ materially from the future results, performance or achievements expressed or implied in those forward-looking statements. Examples of these risks, uncertainties and other factors include, but are not limited to, the following: the impact of the economic and geopolitical environment, including changing tariffs and the related uncertainty thereof, on key aspects of our business, such as the demand for cruises, passenger spending, and operating costs; changes in operating costs; the unavailability or cost of air service; disease outbreaks and increased concern about the risk of illness on our ships or when travelling to or from our ships, which could cause a decrease in demand, guest cancellations, and ship redeployments; incidents or adverse publicity concerning our ships, port facilities, land destinations and/or passengers or the cruise vacation industry in general; the effects of weather, climate events and/or natural disasters on our business; risks related to our sustainability activities; the impact of issues at shipyards, including ship delivery delays, ship cancellations or ship construction cost increases; shipyard unavailability; unavailability of ports of call; vacation industry competition and increase in industry capacity and overcapacity; inability to manage our cost and capital allocation strategies; the uncertainties of conducting business globally and expanding into new markets and new ventures, including potential acquisitions; issues with travel advisers that sell and market our cruises; reliance on third-party service providers; potential unavailability of insurance coverage; the risks and costs related to cyber security attacks, data breaches, protecting our systems and maintaining data integrity and security; uncertainties of a foreign legal system as we are not incorporated in the United States; our ability to obtain sufficient financing or capital to fund our capital expenditures, operations, debt repayments and other financing needs; our expectation and ability to pay a cash dividend on our common stock in the future; changes to our dividend policy; growing anti-tourism sentiments and environmental concerns; changes in U.S. or other countries’ foreign travel policy; impact of new or changing legislation and regulations (including environmental regulations) or governmental orders on our business; fluctuations in foreign currency exchange rates, fuel prices and interest rates; further impairments of our goodwill, long-lived assets, equity investments and notes receivable; an inability to source our crew or our provisions and supplies from certain places; our ability to recruit, develop and retain high quality personnel; and pending or threatened litigation, investigations and enforcement actions.
More information about factors that could affect our operating results is included under the caption “Risk Factors” in our most recent annual report on Form 10-K, as well as our other filings with the SEC, copies of which may be obtained by visiting our Investor Relations website at www.rclinvestor.com or the SEC’s website at www.sec.gov. Undue reliance should not be placed on the forward-looking statements in this release, which are based on information available to us on the date hereof. We undertake no obligation to publicly update or revise any forward-looking statements, whether as a result of new information, future events or otherwise.
Adjusted Measures of Financial Performance
This press release includes certain adjusted financial measures defined as non-GAAP financial measures under Securities and Exchange Commission rules, which we believe provide useful information to investors as a supplement to our consolidated financial statements, which are prepared and presented in accordance with generally accepted accounting principles, or U.S. GAAP.
The presentation of adjusted financial information is not intended to be considered in isolation or as a substitute for, or superior to, the financial information prepared and presented in accordance with U.S. GAAP. These measures may be different from adjusted measures used by other companies. In addition, these adjusted measures are not based on any comprehensive set of accounting rules or principles. Adjusted measures have limitations in that they do not reflect all of the amounts associated with our results of operations as do the corresponding U.S. GAAP measures.
A reconciliation to the most comparable U.S. GAAP measure of all adjusted financial measures included in this press release can be found in the tables included at the end of this press release. We have not provided a quantitative reconciliation of the projected non-GAAP financial measures to the most comparable GAAP financial measures because preparation of meaningful U.S. GAAP projections would require unreasonable effort. Due to significant uncertainty, we are unable to predict, without unreasonable effort, the future movement of foreign exchange rates, fuel prices and interest rates inclusive of our related hedging programs. In addition, we are unable to determine the future impact of non-core business related gains and losses which may result from strategic initiatives. These items are uncertain and could be material to our results of operations in accordance with U.S. GAAP. Due to this uncertainty, we do not believe that reconciling information for such projected figures would be meaningful.
|
ROYAL CARIBBEAN CRUISES LTD. |
|||||||
|
CONSOLIDATED STATEMENTS OF COMPREHENSIVE INCOME (LOSS) |
|||||||
|
(unaudited, in millions, except per share data) |
|||||||
|
Quarter Ended |
Nine Months Ended |
||||||
|
September 30, |
September 30, |
||||||
|
2026 |
2025 |
2026 |
2025 |
||||
|
Passenger ticket revenues |
$ 3,885 |
$ 3,637 |
$ 10,250 |
$ 9,579 |
|||
|
Onboard and other revenues |
1,706 |
1,502 |
4,625 |
4,097 |
|||
|
Total revenues |
5,591 |
5,139 |
14,876 |
13,676 |
|||
|
Cruise operating expenses: |
|||||||
|
Commissions, transportation and other |
735 |
696 |
1,921 |
1,823 |
|||
|
Onboard and other |
338 |
312 |
838 |
775 |
|||
|
Payroll and related |
399 |
342 |
1,204 |
1,010 |
|||
|
Food |
287 |
264 |
813 |
750 |
|||
|
Fuel |
347 |
297 |
966 |
854 |
|||
|
Other operating |
606 |
569 |
1,763 |
1,630 |
|||
|
Total cruise operating expenses |
2,711 |
2,479 |
7,506 |
6,841 |
|||
|
Marketing, selling and administrative expenses |
519 |
522 |
1,615 |
1,593 |
|||
|
Depreciation and amortization expenses |
490 |
435 |
1,415 |
1,265 |
|||
|
Operating Income |
1,871 |
1,702 |
4,340 |
3,977 |
|||
|
Other income (expense): |
|||||||
|
Interest income |
5 |
3 |
15 |
17 |
|||
|
Interest expense, net of interest capitalized |
(291) |
(248) |
(805) |
(725) |
|||
|
Equity investment income |
176 |
158 |
328 |
313 |
|||
|
Other income (expense) |
1 |
(2) |
10 |
13 |
|||
|
Income before income taxes |
1,762 |
1,612 |
3,887 |
3,596 |
|||
|
Provision for income taxes |
(27) |
(34) |
(66) |
(67) |
|||
|
Net Income |
1,735 |
1,579 |
3,821 |
3,529 |
|||
|
Less: Net Income attributable to noncontrolling interest |
7 |
4 |
23 |
15 |
|||
|
Net Income attributable to Royal Caribbean Cruises Ltd. |
$ 1,728 |
$ 1,575 |
$ 3,798 |
$ 3,514 |
|||
|
Earnings per Share: |
|||||||
|
Basic |
$ 6.46 |
$ 5.79 |
$ 14.15 |
$ 12.97 |
|||
|
Diluted |
$ 6.45 |
$ 5.74 |
$ 14.12 |
$ 12.83 |
|||
|
Weighted-Average Shares Outstanding: |
|||||||
|
Basic |
267 |
272 |
268 |
271 |
|||
|
Diluted |
268 |
274 |
269 |
275 |
|||
|
Comprehensive Income (Loss) |
|||||||
|
Net Income |
$ 1,735 |
$ 1,579 |
$ 3,821 |
$ 3,529 |
|||
|
Other comprehensive income (loss): |
|||||||
|
Foreign currency translation adjustments |
(6) |
(2) |
(6) |
(28) |
|||
|
Change in defined benefit plans |
7 |
(2) |
11 |
(2) |
|||
|
Gain (loss) on cash flow derivative hedges |
131 |
(5) |
215 |
304 |
|||
|
Total other comprehensive income (loss) |
133 |
(9) |
220 |
274 |
|||
|
Comprehensive Income |
1,868 |
1,570 |
4,042 |
3,803 |
|||
|
Less: Comprehensive Income attributable to noncontrolling interest |
7 |
4 |
23 |
15 |
|||
|
Comprehensive Income attributable to Royal Caribbean Cruises Ltd. |
$ 1,861 |
$ 1,566 |
$ 4,018 |
$ 3,788 |
|||
|
Certain amounts may not add or calculate due to use of rounded numbers. |
|
ROYAL CARIBBEAN CRUISES LTD. |
|||||||
|
STATISTICS |
|||||||
|
(unaudited) |
|||||||
|
Quarter Ended |
Nine Months Ended |
||||||
|
September 30, |
September 30, |
||||||
|
2026 |
2025 |
2026 |
2025 |
||||
|
Passengers Carried |
2,676,480 |
2,466,039 |
7,567,360 |
6,961,768 |
|||
|
Passenger Cruise Days |
16,692,392 |
15,356,271 |
46,527,802 |
43,402,497 |
|||
|
APCD |
14,844,688 |
13,698,886 |
42,119,787 |
39,299,263 |
|||
|
Occupancy |
112.4 % |
112.1 % |
110.5 % |
110.4 % |
|||
|
ROYAL CARIBBEAN CRUISES LTD. |
|||
|
CONSOLIDATED BALANCE SHEETS |
|||
|
(in millions, except share data) |
|||
|
As of |
|||
|
September 30, |
December 31, |
||
|
2026 |
2025 |
||
|
(unaudited) |
|||
|
Assets |
|||
|
Current assets |
|||
|
Cash and cash equivalents |
$ 851 |
$ 825 |
|
|
Trade and other receivables, net |
409 |
317 |
|
|
Inventories |
304 |
264 |
|
|
Prepaid expenses and other assets |
750 |
690 |
|
|
Derivative financial instruments |
160 |
115 |
|
|
Total current assets |
2,474 |
2,211 |
|
|
Property and equipment, net |
38,297 |
35,696 |
|
|
Operating lease right-of-use assets |
751 |
620 |
|
|
Goodwill |
808 |
808 |
|
|
Other assets |
2,483 |
2,284 |
|
|
Total assets |
$ 44,813 |
$ 41,619 |
|
|
Liabilities and Shareholders’ Equity |
|||
|
Current liabilities |
|||
|
Current portion of long-term debt |
$ 2,239 |
$ 3,180 |
|
|
Current portion of operating lease liabilities |
71 |
90 |
|
|
Accounts payable |
979 |
953 |
|
|
Accrued expenses and other liabilities |
1,983 |
2,026 |
|
|
Derivative financial instruments |
107 |
67 |
|
|
Customer deposits |
6,034 |
5,739 |
|
|
Total current liabilities |
11,413 |
12,055 |
|
|
Long-term debt |
20,116 |
18,165 |
|
|
Long-term operating lease liabilities |
744 |
600 |
|
|
Other long-term liabilities |
627 |
554 |
|
|
Total liabilities |
32,900 |
31,374 |
|
|
Shareholders’ equity |
|||
|
Preferred stock ($0.01 par value; 20,000,000 shares authorized; none outstanding) |
— |
— |
|
|
Common stock ($0.01 par value; 500,000,000 shares authorized; 303,899,853 and 303,054,848 shares |
3 |
3 |
|
|
Paid-in capital |
7,916 |
7,964 |
|
|
Retained earnings |
8,512 |
5,925 |
|
|
Accumulated other comprehensive loss |
(384) |
(604) |
|
|
Treasury stock (36,429,278 and 32,631,826 common shares at cost, at September 30, 2026 and |
(4,334) |
(3,251) |
|
|
Total shareholders’ equity attributable to Royal Caribbean Cruises Ltd. |
11,713 |
10,037 |
|
|
Noncontrolling Interest |
200 |
208 |
|
|
Total shareholders’ equity |
11,913 |
10,245 |
|
|
Total liabilities and shareholders’ equity |
$ 44,813 |
$ 41,619 |
|
|
ROYAL CARIBBEAN CRUISES LTD. |
|||
|
CONSOLIDATED STATEMENTS OF CASH FLOW |
|||
|
(unaudited; in millions) |
|||
|
Nine Months Ended September 30, |
|||
|
2026 |
2025 |
||
|
Operating Activities |
|||
|
Net Income |
$ 3,821 |
$ 3,529 |
|
|
Adjustments: |
|||
|
Depreciation and amortization |
1,415 |
1,265 |
|
|
Net deferred income tax (benefit) expense |
(5) |
15 |
|
|
Loss (Gain) on derivative instruments not designated as hedges |
4 |
(45) |
|
|
Share-based compensation expense |
94 |
136 |
|
|
Equity investment income |
(328) |
(313) |
|
|
Amortization of debt issuance costs, discounts and premiums |
16 |
72 |
|
|
Loss on extinguishment of debt and inducement expense |
105 |
10 |
|
|
Changes in operating assets and liabilities: |
|||
|
Increase in trade and other receivables, net |
(109) |
(34) |
|
|
Increase in inventories |
(40) |
(4) |
|
|
Increase in prepaid expenses and other assets |
(112) |
(42) |
|
|
Decrease in accounts payable |
(60) |
(100) |
|
|
(Decrease) increase in accrued expenses and other liabilities |
(220) |
19 |
|
|
Increase in customer deposits |
295 |
108 |
|
|
Dividends received from unconsolidated affiliates |
309 |
263 |
|
|
Other, net |
89 |
(37) |
|
|
Net cash provided by operating activities |
5,274 |
4,842 |
|
|
Investing Activities |
|||
|
Purchases of property and equipment |
(3,880) |
(3,722) |
|
|
Cash received on settlement of derivative financial instruments |
122 |
144 |
|
|
Cash paid on settlement of derivative financial instruments |
(27) |
(12) |
|
|
Investments in and loans to unconsolidated affiliates |
(49) |
(94) |
|
|
Cash received on loans from unconsolidated affiliates |
— |
126 |
|
|
Other, net |
2 |
25 |
|
|
Net cash used in investing activities |
(3,832) |
(3,533) |
|
|
Financing Activities |
|||
|
Debt proceeds |
7,227 |
3,162 |
|
|
Debt issuance costs |
(124) |
(100) |
|
|
Repayments of debt |
(6,236) |
(3,075) |
|
|
Repurchase of common stock |
(1,035) |
(655) |
|
|
Dividends paid |
(1,075) |
(552) |
|
|
Payments of withholding tax on stock awards |
(191) |
(63) |
|
|
Other, net |
19 |
11 |
|
|
Net cash used in financing activities |
(1,415) |
(1,272) |
|
|
Effect of exchange rate changes on cash and cash equivalents |
(1) |
7 |
|
|
Net increase in cash and cash equivalents |
26 |
44 |
|
|
Cash and cash equivalents at beginning of period |
825 |
388 |
|
|
Cash and cash equivalents at end of period |
$ 851 |
$ 432 |
|
|
Supplemental Disclosure |
|||
|
Cash paid during the period for: |
|||
|
Interest, net of amount capitalized |
$ 739 |
$ 709 |
|
|
Non-cash Investing Activities |
|||
|
Purchase of property and equipment included in accounts payable and accrued expenses and other liabilities |
$ 137 |
$ 83 |
|
|
ROYAL CARIBBEAN CRUISES LTD. |
|||||||||||
|
NON-GAAP RECONCILING INFORMATION |
|||||||||||
|
(unaudited) |
|||||||||||
|
Gross Margin Yields, Net Yields and Adjusted Gross Margin per PCD are calculated as follows (in millions, except APCD, PCD, Yields, and Adjusted Gross |
|||||||||||
|
Quarter Ended September 30, |
Nine Months Ended September 30, |
||||||||||
|
2026 |
2026 On a |
2025 |
2026 |
2026 On a |
2025 |
||||||
|
Total revenues |
$ 5,591 |
$ 5,579 |
$ 5,139 |
$ 14,876 |
$ 14,767 |
$ 13,676 |
|||||
|
Less: |
|||||||||||
|
Cruise operating expenses |
2,711 |
2,715 |
2,479 |
7,506 |
7,478 |
6,841 |
|||||
|
Depreciation and amortization expenses |
490 |
490 |
435 |
1,415 |
1,419 |
1,265 |
|||||
|
Gross Margin |
2,390 |
2,374 |
2,225 |
5,955 |
5,870 |
5,570 |
|||||
|
Add: |
|||||||||||
|
Payroll and related |
399 |
399 |
342 |
1,204 |
1,204 |
1,010 |
|||||
|
Food |
287 |
287 |
264 |
813 |
813 |
750 |
|||||
|
Fuel |
347 |
347 |
297 |
966 |
967 |
854 |
|||||
|
Other operating |
606 |
609 |
569 |
1,763 |
1,748 |
1,630 |
|||||
|
Depreciation and amortization expenses |
490 |
490 |
435 |
1,415 |
1,419 |
1,265 |
|||||
|
Adjusted Gross Margin |
$ 4,519 |
$ 4,506 |
$ 4,131 |
$ 12,116 |
$ 12,021 |
$ 11,077 |
|||||
|
APCD |
14,844,688 |
14,844,688 |
13,698,886 |
42,119,787 |
42,119,787 |
39,299,263 |
|||||
|
Passenger Cruise Days |
16,692,392 |
16,692,392 |
15,356,271 |
46,527,802 |
46,527,802 |
43,402,497 |
|||||
|
Gross Margin Yields |
$ 161.03 |
$ 159.95 |
$ 162.39 |
$ 141.38 |
$ 139.36 |
$ 141.73 |
|||||
|
Net Yields |
$ 304.41 |
$ 303.54 |
$ 301.58 |
$ 287.66 |
$ 285.39 |
$ 281.87 |
|||||
|
Adjusted Gross Margin per PCD |
$ 270.71 |
$ 269.94 |
$ 269.03 |
$ 260.40 |
$ 258.35 |
$ 255.22 |
|||||
|
ROYAL CARIBBEAN CRUISES LTD. |
|||||||||||
|
NON-GAAP RECONCILING INFORMATION |
|||||||||||
|
(unaudited) |
|||||||||||
|
Gross Cruise Costs, Net Cruise Costs and Net Cruise Costs excluding Fuel are calculated as follows (in millions, except APCD and costs per APCD. Certain |
|||||||||||
|
Quarter Ended September 30, |
Nine Months Ended September 30, |
||||||||||
|
2026 |
2026 On a |
2025 |
2026 |
2026 On a |
2025 |
||||||
|
Total cruise operating expenses |
$ 2,711 |
$ 2,715 |
$ 2,479 |
$ 7,506 |
$ 7,478 |
$ 6,841 |
|||||
|
Marketing, selling and administrative expenses |
519 |
519 |
522 |
1,615 |
1,604 |
1,593 |
|||||
|
Gross Cruise Costs |
3,231 |
3,234 |
3,001 |
9,121 |
9,083 |
8,434 |
|||||
|
Less: |
|||||||||||
|
Commissions, transportation and other |
735 |
735 |
696 |
1,921 |
1,909 |
1,823 |
|||||
|
Onboard and other |
338 |
338 |
312 |
838 |
837 |
775 |
|||||
|
Net Cruise Costs including other costs |
2,158 |
2,161 |
1,993 |
6,361 |
6,336 |
5,836 |
|||||
|
Less: |
|||||||||||
|
Restructuring charges and other initiative expenses (1) |
9 |
9 |
1 |
11 |
11 |
7 |
|||||
|
Net Cruise Costs |
2,149 |
2,152 |
1,992 |
6,350 |
6,325 |
5,829 |
|||||
|
Less: |
|||||||||||
|
Fuel |
347 |
347 |
297 |
966 |
967 |
854 |
|||||
|
Net Cruise Costs excluding Fuel |
$ 1,802 |
$ 1,805 |
$ 1,695 |
$ 5,383 |
$ 5,358 |
$ 4,976 |
|||||
|
APCD |
14,844,688 |
14,844,688 |
13,698,886 |
42,119,787 |
42,119,787 |
39,299,263 |
|||||
|
Gross Cruise Costs per APCD |
$ 217.64 |
$ 217.85 |
$ 219.09 |
$ 216.54 |
$ 215.64 |
$ 214.61 |
|||||
|
Net Cruise Costs per APCD |
$ 144.79 |
$ 144.96 |
$ 145.44 |
$ 150.76 |
$ 150.16 |
$ 148.33 |
|||||
|
Net Cruise Costs excluding Fuel per APCD |
$ 121.38 |
$ 121.56 |
$ 123.75 |
$ 127.81 |
$ 127.21 |
$ 126.61 |
|||||
|
(1) |
These amounts are included in Marketing, selling and administrative expenses within our consolidated statements of comprehensive income (loss). |
|
ROYAL CARIBBEAN CRUISES LTD. |
||||||||
|
NON-GAAP RECONCILING INFORMATION |
||||||||
|
(unaudited) |
||||||||
|
EBITDA, Adjusted EBITDA and Adjusted EBITDA Margin are calculated as follows (in millions, except APCD and per APCD data. Certain amounts may not |
||||||||
|
Quarter Ended September 30, |
Nine Months Ended September 30, |
|||||||
|
2026 |
2025 |
2026 |
2025 |
|||||
|
Net Income attributable to Royal Caribbean Cruises Ltd. |
$ 1,728 |
$ 1,575 |
$ 3,798 |
$ 3,514 |
||||
|
Interest income |
(5) |
(3) |
(15) |
(17) |
||||
|
Interest expense, net of interest capitalized |
291 |
248 |
805 |
725 |
||||
|
Depreciation and amortization expenses |
490 |
435 |
1,415 |
1,265 |
||||
|
Provision for income taxes |
27 |
34 |
66 |
67 |
||||
|
EBITDA |
2,531 |
2,289 |
6,069 |
5,553 |
||||
|
Other (income) expense |
(1) |
2 |
(10) |
(13) |
||||
|
Restructuring charges and other initiative expenses (1) |
9 |
1 |
11 |
7 |
||||
|
Equity investment impairment, (recovery) of losses and other |
— |
— |
— |
(1) |
||||
|
Adjusted EBITDA |
$ 2,539 |
$ 2,293 |
$ 6,071 |
$ 5,545 |
||||
|
Total revenues |
$ 5,591 |
$ 5,139 |
$ 14,876 |
$ 13,676 |
||||
|
APCD |
14,844,688 |
13,698,886 |
42,119,787 |
39,299,263 |
||||
|
Net Income attributable to Royal Caribbean Cruises Ltd. per APCD |
$ 116.44 |
$ 114.94 |
$ 90.18 |
$ 89.42 |
||||
|
Adjusted EBITDA per APCD |
$ 171.01 |
$ 167.35 |
$ 144.13 |
$ 141.09 |
||||
|
Adjusted EBITDA Margin |
45.4 % |
44.6 % |
40.8 % |
40.5 % |
||||
|
(1) |
These amounts are included in Marketing, selling and administrative expenses within our consolidated statements of comprehensive income (loss). |
|
ROYAL CARIBBEAN CRUISES LTD. |
|||||||
|
NON-GAAP RECONCILING INFORMATION |
|||||||
|
(unaudited) |
|||||||
|
Adjusted Net Income attributable to Royal Caribbean Cruises Ltd., and Adjusted Earnings per Share are calculated as follows (in millions, except per share data. Certain amounts may not add |
|||||||
|
Quarter Ended September 30, |
Nine Months Ended September 30, |
||||||
|
2026 |
2025 |
2026 |
2025 |
||||
|
Net Income attributable to Royal Caribbean Cruises Ltd. |
$ 1,728 |
$ 1,575 |
$ 3,798 |
$ 3,514 |
|||
|
Loss on extinguishment of debt and inducement expense (1) |
21 |
— |
50 |
10 |
|||
|
Restructuring charges and other initiative expenses (2) |
9 |
1 |
11 |
7 |
|||
|
Amortization of Silversea intangible assets resulting from the Silversea acquisition |
2 |
2 |
5 |
5 |
|||
|
Gain on sale of noncontrolling interest (3) |
— |
— |
— |
(11) |
|||
|
Equity investment impairment, (recovery) of losses and other |
— |
— |
— |
(1) |
|||
|
Adjusted Net Income attributable to Royal Caribbean Cruises Ltd. |
$ 1,760 |
$ 1,577 |
$ 3,865 |
$ 3,523 |
|||
|
Earnings per Share – Diluted (4) |
$ 6.45 |
$ 5.74 |
$ 14.12 |
$ 12.83 |
|||
|
Adjusted Earnings per Share – Diluted (5) |
$ 6.57 |
$ 5.75 |
$ 14.36 |
$ 12.83 |
|||
|
Weighted-Average Shares Outstanding – Diluted |
268 |
274 |
269 |
275 |
|||
|
(1) |
For 2026, includes the loss on extinguishment of debt associated with the February and August redemptions of debt. For 2025, includes $10 million of inducement expense related to the settlements of the 2025 6.00% convertible notes. These amounts are included in Interest expense, net of interest capitalized within our consolidated statements of comprehensive income (loss). |
|
(2) |
These amounts are included in Marketing, selling and administrative expenses within our consolidated statements of comprehensive income (loss). |
|
(3) |
For 2025, represents gain on sale of noncontrolling interest of Floating Docks and Grand Bahama Shipyard. These amounts are included in Other income (expense) within our consolidated statements of comprehensive income (loss). |
|
(4) |
For 2025, diluted EPS includes the add-back of dilutive inducement and interest expense related to our convertible notes of $16 million for the nine months ended September 30, 2025. |
|
(5) |
For 2025, Adjusted Diluted EPS includes the add-back of dilutive interest expense related to our convertible notes of $6 million for the nine months ended September 30, 2025. |
 View original content to download multimedia:https://www.prnewswire.co.uk/news-releases/royal-caribbean-group-reports-third-quarter-results-above-expectations-and-raises-full-year-guidance-302920592.html

- 0
- By Sai Krishna

27, Oct 2026
SBI Life launches ‘Waiver of Premium’ rider, ensuring continuity of policyholders’ long-term financial plans
New rider waives all future premiums upon occurrence of specified contingencies, helping customers maintain continuity of their life insurance plans
MUMBAI, India, Oct. 27, 2026 /PRNewswire/ — SBI Life Insurance, one of India’s most trusted private life insurers, launched ‘Waiver of Premium‘ rider, designed to ensure that policyholders’ long-term financial plans are not derailed by setbacks in life, such as a critical illness or disability.

Financial planning is inherently long term, with commitments often extending across several years. Whether it is planning for a child’s education, preparing for retirement, creating financial security for loved ones or meeting other important financial commitments, staying on track requires not only adequate protection but also the ability to sustain the financial commitment over time. An unforeseen event can impact one’s ability to meet premium commitments. SBI Life’s ‘Waiver of Premium’ rider addresses this need by waiving-off all future premiums (including extra premiums) upon the occurrence of specified contingencies covered under the rider, helping the base policy and other attached riders to continue as envisioned. Thus, families remain protected and long-term goals such as child’s education, retirement etc stay on course even when policyholder is unable to continue paying.
Available with select individual non-linked & linked life insurance products, the rider adds an additional layer of resilience to the financial commitment underlying a life insurance plan. Commenting on the launch, Mr. M. Anand, President & Chief Distribution Officer, SBI Life Insurance, said, “Financial security is not only about preparing for what lies ahead, but also about building resilience into future financial commitments. As customers plan across longer financial horizons, protection solutions need to address not just the risks they anticipate, but also the potential impact of unforeseen circumstances on their ability to sustain those plans. SBI Life’s Waiver of Premium rider is designed with this perspective, adding an important layer of continuity to long-term financial planning.” He further added, “At SBI Life, our endeavour is to make protection more relevant to the way customers approach financial planning today. The new rider reflects this approach by strengthening the resilience of life insurance plans against specified contingencies. By helping preserve continuity when circumstances change, the rider reinforces our commitment to enabling customers to approach their financial future with greater confidence and preparedness.”
Key features of ‘Waiver of Premium Riders’:
- Premium continuity: All future premiums (including extra premiums) are waived upon specified contingencies, helping the base policy and other attached riders to continue as per their terms.
- Specified Protection: The rider covers Accidental Total Permanent Disability (ATPD) and 21 specified critical illnesses when the proposer and life assured are the same.
- Protection for the proposer: The rider covers the proposer’s death, ATPD and 21 specified critical illnesses when the proposer and life assured are different.
- Flexible entry: Can be opted at inception or at a subsequent policy anniversary, subject to eligibility and a minimum outstanding premium payment term of five years.
With the launch of the ‘Waiver of Premium’ rider, SBI Life Insurance continues to strengthen its portfolio of customer-centric protection solutions that encourage disciplined financial planning and help individuals and families stay invested in their dreams, regardless of life’s uncertainties.
About SBI Life Insurance
SBI Life Insurance (‘SBI Life’ / ‘The Company’), one of the most trusted life insurance companies in India, was incorporated in October 2000 and is registered with the Insurance Regulatory and Development Authority of India (IRDAI) in March 2001.
Serving millions of families across India, SBI Life’s diverse range of products caters to individuals as well as group customers through Protection, Pension, Savings and Health solutions.
Driven by ‘Customer-First’ approach, SBI Life places great emphasis on maintaining world class operating efficiency and providing hassle-free claim settlement experience to its customers by following high ethical standards of service. Additionally, SBI Life is committed to enhance digital experiences for its customers, distributors and employees alike.
SBI Life strives to make insurance accessible to all, with its extensive presence across the country through its 1,241 offices, 29,055 employees, a large and productive network of about 2,93,443 agents, 81 corporate agents and 9 bancassurance partners with more than 40,000 partner branches, 161 brokers and other insurance marketing firms.
In addition to doing what’s right for the customers, the company is also committed to provide a healthy and flexible work environment for its employees to excel personally and professionally.
SBI Life strongly encourages a culture of giving back to the society and has made substantial contribution in the areas of child education, healthcare, disaster relief and environmental upgrade. In 2025-26, the Company touched over 20,500 direct beneficiaries through various CSR interventions.
Listed on the Bombay Stock Exchange (‘BSE’) and the National Stock Exchange (‘NSE’), the company has an authorized capital of ₹20.0 billion and a paid up capital of ₹10.0 billion. The AuM is ₹5,248.5 billion.
For more information, please visit our website- www.sbilife.co.in and connect with us on Facebook, Twitter, YouTube, Instagram, and LinkedIn.
(Numbers & data mentioned above are for the period ended June 30, 2026)
 View original content to download multimedia:https://www.prnewswire.com/in/news-releases/sbi-life-launches-waiver-of-premium-rider-ensuring-continuity-of-policyholders-long-term-financial-plans-302920625.html

27, Oct 2026
MEXC and Hacken Launch AI Trading Safety Handbook to Promote Safer AI Adoption
MUTSAMUDU, Comoros, Oct. 27, 2026 /PRNewswire/ — MEXC, a pioneer in 0-fee digital asset trading, and blockchain security, compliance, and regulatory assurance partner Hacken, have released the MEXC × Hacken AI Trading Safety Handbook, providing practical guidance on how users and platforms can use and deploy AI-assisted and automated trading tools more safely, from research and decision support through trade execution.

The handbook follows the recent MEXC AI Trading Report, which found strong interest in AI alongside clear demand for greater control. In MEXC’s 2026 survey, willingness to use automated trading rose from 55% to 71.8% when limits on funds, positions, leverage and losses were introduced.
As AI takes a more active role in trading, the handbook emphasizes that safety cannot rely on the AI model alone. AI-facilitated actions should be checked against separate permissions, financial limits and risk controls before execution. It covers risks including credential exposure, excessive permissions, manipulated data and unintended execution, while outlining practical safeguards for both users and platforms.
For users, the handbook sets out five safety checks: Ask, Verify, Limit, Control and Review. For platforms, it outlines five principles: Guard, Limit, Approve, Controls and Test. Together, they provide a practical framework for expanding the use of AI while keeping appropriate controls in place.
“AI can make trading more accessible and efficient, but greater capability should come with stronger safeguards,” said Vugar Usi Zade, CEO of MEXC. “At MEXC, we want users to benefit from innovation, while taking a measured approach to AI adoption. Our People First principle means giving users access to new capabilities without losing sight of control, transparency and risk.”
“AI agents will soon place more orders than people do. Trust in them should be earned the way smart contracts earned it: through independent controls, continuous red-teaming and evidence anyone can verify,” said Dyma Budorin, CEO and co-founder of Hacken. “This handbook is intended to raise awareness of those risks and provide practical support for both users and platforms. As adoption grows, platforms will need to test these safeguards continuously and strengthen them as new risks emerge.”
MEXC and Hacken hope the handbook can serve as a practical reference for users and platforms as AI becomes more deeply integrated into trading, helping raise risk awareness and support safer, more responsible adoption across the industry.
About MEXC
Founded in 2018, MEXC is a leading global multi-asset trading platform built as your 0-fee gateway to infinite opportunities. Serving users across 170+ markets, MEXC provides simple and efficient access to crypto, stocks, tokenized assets, derivatives, and a growing range of TradFi-linked opportunities through one account and one gateway.
With 0 trading fees, deep liquidity, broad asset coverage, and a high-performance trading experience, MEXC is designed for retail users who want to discover earlier, act faster, and trade with fewer barriers. As crypto and traditional finance continue to converge, MEXC is committed to making global opportunities more accessible, helping users trade freely and MEXCmize every opportunity.
MEXC Official Website| X | Telegram |How to Sign Up on MEXC
About Hacken
Hacken is a security and assurance partner for financial institutions and the infrastructure they rely on: exchanges, ecosystems, custodians, banks, asset managers, and tokenization platforms. Hacken’s AI security work includes AI agent security audits and red-teaming of AI systems.
Founded in 2017, Hacken has 60+ engineers and more than 1,500 clients across industries, including the European Commission, ADGM, Ethereum Foundation, Societe Generale-Forge, MetaMask, and Bybit.
Hacken website | X | LinkedIn
 View original content to download multimedia:https://www.prnewswire.co.uk/news-releases/mexc-and-hacken-launch-ai-trading-safety-handbook-to-promote-safer-ai-adoption-302920502.html

27, Oct 2026
EDC and EFA sign Memorandum of Understanding to deepen Canada-Australia trade and investment ties
Partnership between Canada and Australia’s export credit agencies opens opportunities for businesses in both countries
SYDNEY, Oct. 27, 2026 /PRNewswire/ — Export Development Canada (EDC) and Export Finance Australia (EFA) have signed a Memorandum of Understanding (MoU) to strengthen cooperation between the two organizations. The agreement establishes a framework for collaboration on strategic financing opportunities and investment projects that support economic growth, energy security, supply chain resilience and sustainable development.
Through the partnership, EDC and EFA will explore opportunities for co-financing, transaction facilitation, joint outreach and knowledge sharing, while helping connect Canadian and Australian companies and investors to pursue opportunities in areas of mutual interest.
Canada and Australia share a longstanding trade and investment relationship built on strong commercial ties and common economic interests. In 2025, bilateral merchandise trade between the two countries totalled CAD$7.3 billion, with Canadian exports exceeding CAD$3 billion. Since the Comprehensive and Progressive Agreement for Trans-Pacific Partnership (CPTPP) entered into force in 2018, bilateral merchandise trade has grown at an average annual rate of eight per cent.
Australia is the largest destination in the Asia-Pacific region for Canadian direct investment abroad, with Canadian direct investment in Australia reaching CAD$50.1 billion in 2025, while Australia’s direct investment in Canada totalled CAD$36.4 billion. Key areas of opportunity for Canadian and Australian companies include infrastructure, energy and energy transition, mining and critical minerals, agri-food and agtech, digital technologies, defence and aerospace.
Quotes
“Canada and Australia are trusted partners with a growing economic relationship that creates opportunities for workers and businesses in both countries. This past year, bilateral merchandise trade reached $7.3 billion, with Canadian exports exceeding $3 billion and two-way direct investment totalling more than $86 billion. This agreement between EDC and Export Finance Australia will help connect companies, attract investment and unlock opportunities in priority sectors that support long-term economic growth and resilience.”
The Honourable Maninder Sidhu, Canada’s Minister of International Trade
“Canada and Australia have built one of the strongest commercial relationships in the Asia-Pacific region, underpinned by significant two-way investment and complementary economic strengths. This agreement creates new opportunities for EDC and EFA to connect businesses, share expertise and support Canadian and Australian companies as they pursue growth opportunities abroad.”
Alison Nankivell, President and CEO, Export Development Canada
“This collaboration will deepen co-operation with an important likeminded partner, further strengthening our investment capabilities. We both have a shared interest in a secure and prosperous Indo-Pacific, and bringing our two export credit agencies closer together will create more opportunities for Aussie businesses and local jobs.”
Senator the Hon. Don Farrell, Minister for Trade and Tourism
“Australia and Canada have a shared interest in strengthening economic security and creating new opportunities across the Indo-Pacific, and the scale of investment required across infrastructure, critical minerals and the energy transition means collaboration between like-minded partners is increasingly important. This agreement gives EFA and EDC a practical framework to continue to work together, share expertise and explore opportunities where our combined capabilities can make a real difference to Australian and Canadian businesses.”
John Hopkins, Managing Director and CEO, Export Finance Australia
About Export Finance Australia
EFA is the Australian Government’s trade and strategic finance agency, backing Australian exporters, supply chains and overseas investment. EFA helps Australian businesses win work overseas, expand into new markets and participate in global supply chains. EFA also deploys finance to deliver national priorities that strengthen Australia’s economic security and regional partnerships. For more information visit www.exportfinance.gov.au.
About EDC
Export Development Canada (EDC) is a financial Crown corporation dedicated to helping Canadian businesses make an impact at home and abroad. EDC has the financial products and knowledge Canadian companies need to confidently enter new markets, reduce financial risk and grow their business as they go from local to global. Together, EDC and Canadian companies are building a more prosperous, stronger and sustainable economy for all Canadians. For more information and to learn how we can help your company, call us at 1-800-229-0575 or visit www.edc.ca.

27, Oct 2026
Healthware partners with Fujifilm to expand access to precision surgical imaging across India
- Collaboration combines Healthware’s pan-India market reach with Fujifilm’s advanced intra-operative and robotic ultrasound portfolio to empower clinical decision-making.
- Targeting corporate chains, government institutions, and specialized clinics, the partnership seeks to elevate real-time visualization in complex surgical workflows.
HYDERABAD, India, Oct. 27, 2026 /PRNewswire/ — In a significant development for India’s medical technology sector, Healthware, a premier provider of advanced medical devices, has announced a strategic collaboration with Fujifilm, a global leader in diagnostic and optical innovation. This alliance aims to scale up the availability of Fujifilm’s state-of-the-art intra-operative ultrasound systems across healthcare institutions nationwide, addressing critical clinical needs in complex surgical environments.
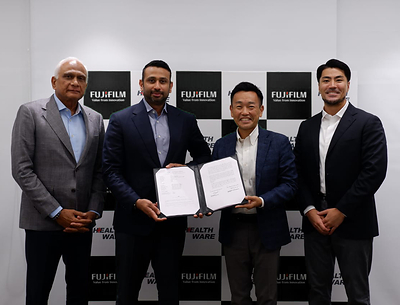
With 37 years of experience in establishing new medical technologies with focus on efficient patient care, Healthware brings an extensive pan-India network supported by dedicated service and clinical application teams. The partnership addresses a diverse healthcare ecosystem spanning government institutions, corporate hospital chains, large hospitals, individual practitioners, and specialized nursing homes and clinics.
Fujifilm’s advanced intra-operative ultrasound portfolio is engineered to transform real-time surgical visualization. Technological innovations integrate seamlessly into existing surgical workflows, enabling precise anatomical identification, accurate tumour boundary assessment, and confident intra-operative navigation.
Commenting on the strategic partnership, K. Tarun Narayan, Director, Healthware, said, “For 37 years, Healthware has been about one thing: bringing world-class medical technology to Indian clinicians and standing behind it every day. Partnering with Fujifilm, a name synonymous with imaging excellence, lets us bring real-time surgical ultrasound to more operating rooms across India, and that is a responsibility we take seriously.”
Echoing this sentiment, Koji Wada, Managing Director, Fujifilm India, said, “At Fujifilm, we believe that meaningful innovation is driven by collaboration and a shared commitment to improving patient care. Our partnership with Healthware marks an important step towards advancing surgical ultrasound solutions in India, bringing real-time imaging closer to the operating room. By combining technological innovation with clinical expertise, we aim to empower healthcare professionals with greater confidence in decision-making and contribute to better patient outcomes. Together, we aspire to make quality healthcare more accessible and create MORE SMILES across India.”
By integrating state-of-the-art surgical technologies into domestic healthcare infrastructure, this strategic alliance opens new business horizons for healthcare providers while reinforcing India’s growing stature as a premier global hub for medical tourism. Empowering clinicians with advanced, modern healthcare solutions directly translates to profound patient-centric benefits minimizing surgical risks, shortening recovery times, and driving sustainable growth within the nation’s healthcare economy.
For clinicians, the partnership brings Fujifilm’s real-time intra-operative ultrasound closer to the operating room across India, supporting precise anatomical identification, accurate tumour boundary assessment and confident intra-operative navigation, while integrating into existing surgical workflows. With Healthware’s pan-India network and its dedicated service and clinical application teams behind it, healthcare professionals gain greater confidence in decision-making. For patients, this means minimised surgical risk, shorter recovery times and better patient outcomes, helping make quality healthcare more accessible across the country.
For more information, please visit: www.healthwareindia.com
 View original content to download multimedia:https://www.prnewswire.com/in/news-releases/healthware-partners-with-fujifilm-to-expand-access-to-precision-surgical-imaging-across-india-302920561.html

27, Oct 2026
ABB turns aging drives into a second life at ACC’s Jamul plant, without stopping production
- To date, on-site drive reconditioning has preserved capital and material value, avoided ~16 metric tons of CO₂ emissions, and maintained continuity, delivering environmental, economic, and operational value in one decision.
- Asset health assessment by ABB helped the major Indian cement producer choose a tailored, multi-year ABB Motion OneCare agreement, for enhanced reliability, uptime, and cost predictability.
- ACC Limited is set to benefit from energy appraisals, scheduled drive reconditioning, and digital monitoring to shift maintenance from reactive to predictive.
BENGALURU, India, Oct. 27, 2026 /PRNewswire/ — ABB has signed a multi-year ABB Motion OneCare service agreement with ACC Limited, a major cement producer in the Adani Group, to improve the operational reliability of ACC’s Jamul cement plant in Chhattisgarh, India. The comprehensive maintenance framework, shaped around ACC’s needs, encompasses scheduled reconditioning, digital monitoring, and energy appraisals, with the latter extending the program’s scope from restoration into ongoing performance enhancement.
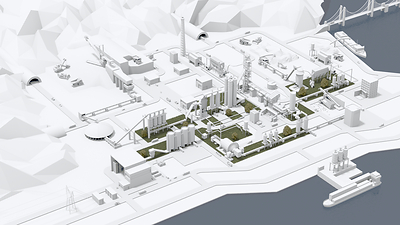
Phase one, completed in April 2026, reconditioned 25 ABB ACS800 variable speed drives on site without a major shutdown. By retaining the existing cabinets and reconditioning equipment rather than replacing complete panels, the project avoided approximately 16 tonnes of CO₂ emissions.
A second phase covering the reconditioning of an additional 25 ACS800 drive modules is planned for Q4 2026. As part of the agreement, ACC also began using ABB Ability™ Digital Powertrain Insights, setting the foundation to shift from reactive to predictive maintenance.
A fleet that delivered — and a clear signal to act
The ABB ACS800 drives at Jamul — installed in 2010 — had maintained a strong reliability record across well over a decade of near-continuous operation in one of the most demanding industrial environments. Over time, however, the cumulative effects of electrical aging reached a point where trip event patterns were no longer in line with the plant’s operational requirements — a natural inflection point for a fleet that had been running full steam since installation, and a clear signal that the time had come to act.
Rather than defaulting to full replacement, ACC engaged ABB’s certified engineers for a structured asset health assessment. The finding was clear: the drives’ cabinets and enclosures remained structurally sound. Targeted reconditioning was both the technically right and most cost-effective route to extended lifetime and sustained reliability.
Expertise brought to the plant
Two decades of working knowledge of ACC’s equipment and operational calendar shaped the approach. ABB developed a service plan tailored to ACC’s shutdown windows and budget cycle. The multi-year ABB Motion OneCare agreement includes scheduled drive reconditioning, ABB Ability™ Digital Powertrain Insights, and energy appraisals. To start, ABB brought its reconditioning expertise directly to Jamul. Earlier this year, 25 ACS800 drives were restored to factory specification without interrupting production, with the original enclosures retained. Phase two is in planning: an additional 25 ACS800 modules are scheduled for on-site reconditioning in the last quarter of 2026.
In addition, with ABB Ability™ Digital Powertrain Insights now active across the fleet, ACC’s teams gain continuous visibility into temperature, current, vibration, and fault patterns — the intelligence to act on emerging issues before they become failures. Energy appraisals, built into the later phase of the program, will extend its scope from restoration into systematic performance improvement. “We know what unchecked wear costs over time: a small inefficiency that eats away at ROI for years. At Jamul, the evidence pointed clearly to assets with productive life still in them,” said Amit Gupta, Local Division Manager, Motion Services, ABB India. “Our job was to restore them properly and give the team the tools to stay ahead of the next problem. At ABB, we don’t just fix what fails. We want to protect what works.”
Circularity as the operating logic
The program reflects the competitive logic of industrial circularity. Restoring what was installed rather than replacing it kept material and economic value in productive use, and protected continuity — all in one decision. ABB data indicates reconditioning reduces drive lifecycle emissions by 50 to 80% versus full replacement. Digital monitoring gives ACC’s teams real-time intelligence: now they know exactly what to fix, and exactly when to fix it, for maximum uptime.
“Moving from reactive firefighting to a structured maintenance plan was exactly what this operation needed. That kind of peace of mind doesn’t come easily. It comes from a partner that understands how your business runs,” added Vinod Bahety, CEO – Cement Business, Adani Group. “We didn’t need a full system overhaul; we needed expert support, actionable insights, and a plan we could execute around our schedule. That’s what we got.”
ABB is a global technology leader in electrification and automation, enabling a more sustainable and resource-efficient future. By connecting its engineering and digitalization expertise, ABB helps industries run at high performance, while becoming more efficient, productive and sustainable so they outperform. At ABB, we call this ‘Engineered to Outrun’. The company has over 140 years of history and around 110,000 employees worldwide. ABB’s shares are listed on the SIX Swiss Exchange (ABBN) and Nasdaq Stockholm (ABB). www.abb.com
ABB Motion, a global leader in motors and drives, is at the core of accelerating a more productive and sustainable future. We innovate and push the boundaries of technology to contribute to energy efficient, decarbonizing and circular solutions for customers, industries and societies. With our digitally enabled drives, motors and services we support our customers and partners to achieve better performance, safety and reliability. To help the world’s industries outrun – leaner and cleaner, we deliver motor-driven solutions for a wide range of applications in all industrial segments. Building on over 140 years of domain expertise in electric powertrains, our more than 23,000 employees across 100 countries learn and improve every day. go.abb/motion
ACC Limited, a subsidiary of Ambuja Cements and part of the diversified Adani Group, is one of India’s most trusted building materials and concrete solutions company. With a legacy of nearly nine decades, ACC operates 20 cement manufacturing sites, 119 ready-mix concrete plants, and a nationwide network of channel partners, serving its customers. ACC is actively advancing its sustainability roadmap with a strong focus on green energy, circular economy, and digital transformation. The Company alongside Ambuja Cements is among the fourth large-scale building materials company in the world committed to net-zero by 2050, with its near-term and science-based net-zero targets validated by the Science Based Targets initiative (SBTi). ACC continues to drive operational excellence through synergies with the Adani Group in logistics, power, project execution, and digital infrastructure. ACC has been recognised India’s Most Sustainable Company 2026 in the Cement Sector by Business Today. Its blended cement products are GreenPro certified, and its innovative products are listed in the GRIHA product catalogue. ACC has been recognised as one of ‘India’s Most Trusted Cement Brands’ by TRA Research and among the ‘Iconic Brands of India 2025’ by The Economic Times for the third consecutive year. https://www.acclimited.com/
 View original content to download multimedia:https://www.prnewswire.com/in/news-releases/abb-turns-aging-drives-into-a-second-life-at-accs-jamul-plant-without-stopping-production-302920411.html

27, Oct 2026
XCMG Deploys Heavy Equipment to Support Nairobi Building Collapse Rescue
XUZHOU, China, Oct. 27, 2026 /PRNewswire/ — XCMG Group joined rescue operations and helped local emergency teams rescue two people after a building under construction collapsed in Nairobi on Oct. 23, according to an Oct. 25 report by Xinhua News Agency.

The 18-story building collapsed on the afternoon of Oct. 23 in the Kenyan capital’s Eastleigh neighborhood. Ground-floor shops were open and construction workers were on site at the time. Following the collapse, the Kenya Defence Forces, the Red Cross and police rushed to the site to conduct search and rescue operations. The large volume of rubble and thick layers of collapsed concrete slabs created an urgent need for heavy lifting and demolition equipment.
XCMG’s Kenya office activated its emergency response procedures upon learning of the collapse. Its team went to the site to coordinate with Kenya’s National Disaster Operations Centre and police rescue personnel. Following a request for assistance, XCMG dispatched an excavator to the site that day, followed by a 25-tonne crane the next day. All equipment and personnel worked under the direction of the on-site rescue team to help rescue people trapped beneath the rubble and clear access routes.
William Sifuna Watitwa, a police personnel officer for the Nairobi North sub-region, told Xinhua that the excavator was crucial to freeing the two survivors. He said the crane enabled crews to lift heavy wreckage from above, reducing the weight of debris and improving access to areas where survivors might be located.
“As a Chinese company that has operated in Kenya for many years, we are part of the local community and stand with it in times of need,” said Fredrick Nyasani, an administrator at XCMG’s Kenya office. “In an emergency like this, XCMG has both a responsibility and a duty to use our specialized equipment and technical personnel to make every effort to support Kenyan rescue teams in saving lives.”
As of Oct. 25, government officials said five people were still missing and four were receiving hospital treatment.
XCMG’s rescue team will continue supporting local rescue operations and remain at the site until its work is complete.

 View original content to download multimedia:https://www.prnewswire.co.uk/news-releases/xcmg-deploys-heavy-equipment-to-support-nairobi-building-collapse-rescue-302920424.html

27, Oct 2026
Zen Technologies Launches Africa’s First AI-Enabled Combat Training Centre (CTC) at AFRIDEX 2026 in Lagos, Nigeria
- A fully integrated combat training hub with multiple simulators for realistic combat training for soldiers
- The CTC will enhance weapon training, tactical drills, Force-on-Force combat exercises and mission rehearsals, with high fidelity simulation systems
MUMBAI, India, Oct. 27, 2026 /PRNewswire/ — Zen Technologies, a global leader in defence training simulation and counter-drone solutions, today launched Africa’s First AI-Enabled Combat Training Centre (CTC) at AFRIDEX 2026 in Lagos, Nigeria.
The Readiness Gap Facing African Forces: Across the continent, African armed forces are confronting an increasingly complex and asymmetric threat environment: counter-insurgency campaign, urban counter-terrorism operations, and the rising pressure of border instability and internal security threats. Yet defence spending across Africa, have historically been weighted toward equipment and platforms rather than the training infrastructure needed to operationalise that equipment effectively. The result is a persistent gap between battlefield-ready hardware and battlefield-ready soldiers, a gap that live-fire ranges and conventional drills alone struggle to close, particularly given the cost, safety constraints and limited repeatability of traditional training methods.
Zen Technologies’ Combat Training Centre (CTC) is built to directly address this gap. The Combat Training Centre (CTC) is an integrated training ecosystem that combines live-fire ranges, force-on-force engagement systems, simulator-based marksmanship training, and a Shoot House for close-quarters combat drills, all unified under a single Common Operating Picture. Designed to train forces from platoon to brigade level, the CTC supports both conventional warfare preparation and Militarized Operations in Urban Terrain (MOUT) / counter-terrorism training. Central to the CTC’s value proposition is Zen’s proprietary Combat Readiness Score (CRS), an AI-derived metric, unique to Zen Technologies, that analyses data captured during training sessions to objectively measure and track the combat preparedness of forces over time.
Key features of the Combat Training Centre (CTC):
- AI-derived Combat Readiness Score (CRS) — analyzes training-session data to objectively measure and track combat preparedness over time, replacing subjective assessment
- Smart live-fire shooting ranges — STS® and MFTS® systems for precision hit detection and reflex shooting training
- Force-on-force engagement training — Zen TacSim® and ACTS, an Instrumented Tactical Systems (ITS) simulating opposed-fire combat scenarios
- Shoot House — dedicated facility for room-clearing and close-quarters battle (CQB) drills
- Simulator-based training — covers infantry weapons, machine guns, and automatic grenade launchers for marksmanship and judgmental shooting skills
- Central Control Room — enables real-time monitoring of all training activity and After Action Review (AAR) for post-exercise analysis
- Common Operating Picture — unifies live, virtual, and constructive training elements under a single integrated system
- Scalable training levels — supports forces from platoon to brigade level
- Dual-mode readiness — designed for both conventional warfare preparation and MOUT/counter-terrorism operations
Zen Technologies’ Combat Training Center (CTC) also features an integrated Naval Training Centre equipped with advanced Naval simulation and training systems. The portfolio includes Bridge Operations, Fast Attack Craft (FAC), Action Speed Tactical Trainer (ASTT), Combat Information Centre (CIC), Submarine Operations, Deep Submergence Rescue Vehicle (DSRV), and Machinery Operations Simulators, alongside other specialised training solutions. These systems are designed to deliver realistic, immersive, and mission-oriented training across diverse naval operational scenarios. The integrated Naval Training Centre will enhance the CTC’s multi-domain training capabilities, helping naval personnel develop operational skills, decision-making capabilities, and combat readiness in a controlled, simulation-based environment.
About Zen Technologies
Founded in 1993 and headquartered in Hyderabad, India, Zen Technologies is a pioneer and global leader in Defence Training Simulators and Counter-Drone Solutions. With a portfolio of over 50 products, more than 200 patents filed, and over 10,000 systems shipped worldwide, Zen Technologies has more than 30 years of experience equipping armed forces, police and paramilitary organisations with realistic, combat-proven training and force-protection systems.
Website: www.zentechnologies.com
 View original content:https://www.prnewswire.com/in/news-releases/zen-technologies-launches-africas-first-ai-enabled-combat-training-centre-ctc-at-afridex-2026-in-lagos-nigeria-302920329.html

27, Oct 2026
Limca Launches Haryana Special Can, Celebrating the State’s Culture, Sporting Spirit and Contemporary Energy
- Homegrown brand Limca celebrates the distinctive spirit of India’s cities and states through limited-edition Special Cans.
NEW DELHI, Oct. 27, 2026 /PRNewswire/ — Limca, Coca-Cola India’s iconic beverage, has unveiled its first-ever Limca Haryana Special Can, a limited-edition collectible that brings the unmistakable spirit of Haryana to life. Created under the idea ‘One State, One Can: Crafted for Collection’, the special edition transforms the everyday Limca can into a canvas of local pride, bringing together Haryana’s culture and heritage. From folk dance and traditional tractors to the state’s celebrated sporting legacy across kushti, boxing, javelin and running, the design captures the many facets that make Haryana unique.

More than a refreshing beverage, the Haryana Special Can is a visually striking keepsake, introducing a new collectible experience for consumers. Created as a limited-edition release, it is designed to inspire discovery, sharing and collectability, while offering young, urban consumers a fresh way to celebrate the city they call home.
The launch also brings the Special Can idea to life through a consumer-led social activation on Instagram featuring Bollywood actor Ananya Panday. The activation will further bring artists and creators into the conversation, encouraging them to share their own interpretations of the city’s culture, landmarks and everyday experiences. Together, these voices invite consumers to engage with the Special Can beyond the product and celebrate the many elements that make the state uniquely their own.
Pankaj Sinha, Senior Director, Integrated Operations, North India, Coca-Cola India, said, “As a loved homegrown brand, Limca brings the character of Haryana to life in a format that consumers can experience, share and make their own. The can is an extension of our approach to building deeper connections, bringing together the city’s vibe and energy. Through our expansive retail network, we are bringing this special edition closer to consumers and placing a piece of Haryana’s identity in their hands.”
Ravinder Pal Singh Bhatia, CEO, Kandhari Global Beverages Pvt Ltd, said, “Limca has an opportunity to connect with consumers through initiatives that are rooted in the character of each market. Haryana is an important market for us, and we are proud to bring this distinctive consumer proposition to life through our distribution capabilities, strong understanding of the region and the communities we serve. We look forward to seeing consumers engage with and make this limited-edition offering their own.”
The Limca Haryana Special Can is now rolling out across Haryana, giving consumers an opportunity to collect a special edition that celebrates the capital’s unique character.
About Coca-Cola:
Coca-Cola in India is one of the country’s leading beverage companies, offering a range of high-quality and refreshing beverage options to consumers. The company, in line with its vision of ‘Beverages For Life’ offers a wide portfolio of products which includes hydration, sports, sparkling, coffee, tea, nutrition, juice and dairy based products. In India its beverage range includes Coca-Cola, Coca-Cola Zero Sugar, Diet Coke, Thums Up, Thums Up XForce, Charged, Fanta, Limca, Sprite, Sprite Zero, Kinley Soda, Rimzim, Maaza, Minute Maid range of juices and Honest Tea. The Company also offers hydration beverages including Limca GlucoCharge, Smartwater, Kinley, Kinley Copper, Dasani and Bonaqua packaged drinking water. Premium products constitute Schweppes’ range and Smartwater. In addition, it offers a Costa Coffee range of tea and coffee. The Company is constantly transforming its portfolio, from reducing sugar in its drinks to bringing innovative new products to market.
The Company along with its owned bottling operations and franchise bottling partners has a strong network of over six million retail outlets through which it refreshes millions of consumers across the country. It seeks to positively impact people’s lives, communities, and the planet through water and packaging initiatives, sustainable agriculture and emission reductions across its value chain.
Globally together with its bottling partners, The Coca-Cola Company employs more than 700,000 people, helping to bring economic opportunity to local communities worldwide. Learn more at www.cocacolacompany.com and follow us on Twitter, Instagram, Facebook and LinkedIn.

 View original content to download multimedia:https://www.prnewswire.com/in/news-releases/limca-launches-haryana-special-can-celebrating-the-states-culture-sporting-spirit-and-contemporary-energy-302920349.html

27, Oct 2026
XCMG Advances Belt and Road Talent Cooperation with Launch of Joint Education Programs for Students from Uzbekistan and Indonesia
XUZHOU, China, Oct. 27, 2026 /PRNewswire/ — XCMG Group recently held opening ceremonies in Xuzhou for joint education programs for students from Uzbekistan and Indonesia, advancing youth talent development in Belt and Road partner countries through international education partnerships. Combining language and academic study with technical training and workplace practice, the programs support local workforce development and XCMG’s overseas operations.
The Uzbekistan program opened on Oct. 13 at Xuzhou University of Technology, where an XCMG construction machinery training base was unveiled.
Jointly developed by XCMG, Xuzhou University of Technology and Urgench State University, the Uzbekistan program follows a phased “2+1+1” model for undergraduate students. Urgench State University selects students and provides their initial education, while Xuzhou University of Technology delivers academic and language instruction. XCMG’s Global Learning and Education Center works with the company’s Uzbekistan operations to develop industry-specific courses and provide internship placements.
The Indonesian program recently opened at Xuzhou College of Industrial Technology. The program follows a phased “1.5+0.5+1” model, connecting language learning, skills training and workplace experience in overseas operations. It is designed to develop versatile technical professionals equipped to meet local business needs.
These training efforts support XCMG’s expanding business presence in Indonesia, where the company has operated for more than 30 years. Its local capabilities span R&D, manufacturing, supply, sales, service and financing. This year, XCMG commissioned its Indonesia New Energy Manufacturing Base and broke ground on the XCMG Indonesia Remanufacturing Center, extending its business from product exports to integrated local operations. Local employees make up nearly 80% of XCMG’s workforce in the country, as the company continues to create local jobs and develop skilled professionals.
To meet local workforce needs across its overseas markets, XCMG has adopted the GEMS framework, whose name combines Global with three talent categories: Executive Functional Staff, Management & Sales Backbone and Skilled Service Specialists. Through partnerships between Chinese and overseas educational institutions, the framework develops local talent, helping its overseas operations meet staffing needs locally and run leaner, more cost-effective operations.
So far, XCMG’s joint education initiatives for students from Uzbekistan and Indonesia have reached three cohorts involving nearly 60 students.
XCMG will continue to expand education partnerships, offering young people worldwide opportunities for academic study, industry practice and cross-cultural exchange while strengthening local talent pipelines for its overseas operations.
 View original content:https://www.prnewswire.co.uk/news-releases/xcmg-advances-belt-and-road-talent-cooperation-with-launch-of-joint-education-programs-for-students-from-uzbekistan-and-indonesia-302920362.html