


24, Oct 2026
India Eyes USD 220 Billion Clean Energy Investment by FY2030 as Renewable Sector Accelerates
New Delhi, Oct 24: India is poised to unlock an estimated $220 billion in clean energy investment opportunities between FY2027 and FY2030, as the country accelerates its transition towards renewable power and advances its ambitious target of 500 GW of non-fossil fuel capacity.
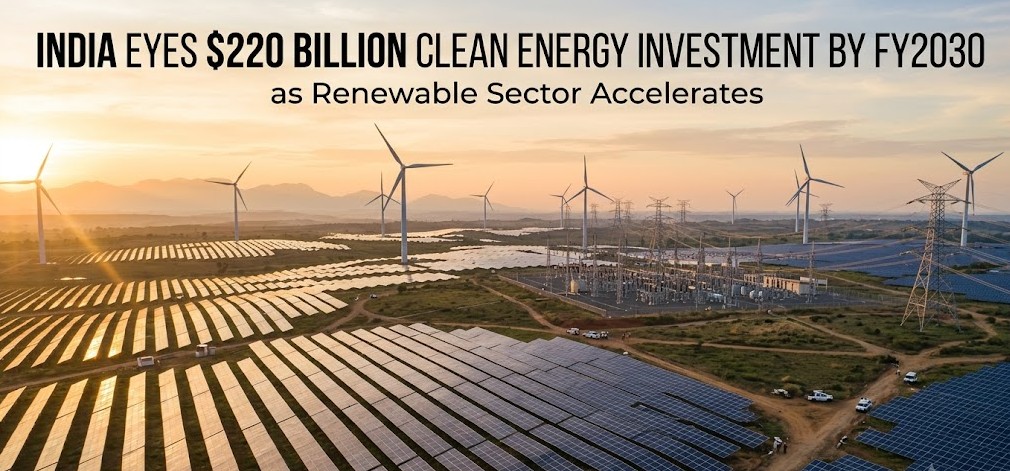
Representational Image
According to the Ministry of New and Renewable Energy (MNRE), the investment opportunity spans the entire clean energy value chain, including solar and wind power, energy storage, domestic manufacturing, electricity transmission, green hydrogen and hydropower. The scale of the opportunity is expected to create significant avenues for private investment, technological innovation and industrial growth.
Private Sector to Drive Clean Energy Expansion
The private sector is emerging as a key driver of India’s energy transition, accounting for nearly 74 per cent of the country’s renewable energy capacity, according to the ministry.
J.V.N. Subramanyam, Joint Secretary at MNRE, emphasised that private investment would remain central to achieving India’s clean energy ambitions, with the government focusing on providing a stable policy framework and an investor-friendly environment.
He described the projected $220 billion opportunity not as a financial constraint but as an indication of the enormous potential for growth across India’s clean energy industry.
The government believes that sustained private capital, supported by predictable policies and reliable project revenues, will be essential to expand renewable energy infrastructure at the required pace.
Policy Support to Strengthen Investor Confidence
Several policy measures are intended to improve the attractiveness of India’s renewable energy sector for domestic and international investors.
These include allowing 100 per cent foreign direct investment (FDI) under the automatic route, introducing payment security mechanisms and maintaining policy support for clean energy development.
The reduction in Goods and Services Tax (GST) on renewable energy equipment from 12 per cent to 5 per cent is also expected to help lower project costs.
In addition, a 500 MW Contract for Difference pilot implemented through the Solar Energy Corporation of India (SECI) aims to strengthen project bankability and provide greater revenue certainty.
Such measures are particularly important for capital-intensive projects that require substantial upfront investment and long-term financial commitments.
Investment Opportunities Across the Energy Value Chain
The projected investment is expected to extend beyond the installation of solar panels and wind turbines. Energy storage, transmission infrastructure and domestic equipment manufacturing will also play critical roles in supporting the expansion of renewable electricity.
Green hydrogen and hydropower are additional areas expected to contribute to India’s broader clean energy strategy.
Expanding transmission networks and storage capacity will be particularly important to integrate variable renewable power into the electricity grid while maintaining reliability as demand grows.
The investment opportunity could also support domestic manufacturing, create new business partnerships and strengthen India’s position in emerging clean energy technologies.
Bharat Renewable Energy Summit to Attract Global Stakeholders
India will host the Bharat Renewable Energy (BRE) Summit and Expo 2026 from November 2 to 5 at Bharat Mandapam in New Delhi.
The event is expected to bring together more than 400 exhibitors and delegates from over 75 countries. It will also incorporate the ninth session of the International Solar Alliance Assembly and the fourth International Conference on Green Hydrogen.
The summit aims to facilitate investment commitments, showcase state-level renewable energy project pipelines, encourage business-to-business partnerships and promote international technology collaboration.
It is expected to provide a platform for policymakers, investors, manufacturers and energy companies to explore opportunities arising from India’s expanding clean energy market.
From 500 GW to Net Zero by 2070
India’s target of achieving 500 GW of non-fossil fuel capacity represents a major milestone in its long-term energy transition. The country has already crossed the halfway mark in terms of the share of non-fossil sources in its total installed power capacity, which now exceeds 54 per cent, according to MNRE.
Looking further ahead, the government has outlined an ambition to reach 1,800 GW of non-fossil fuel capacity by 2047, aligning with its broader vision of Viksit Bharat, or a developed India.
The country has also committed to achieving net-zero emissions by 2070.
However, meeting these goals will require substantial financial resources, faster infrastructure development, technological advancement and stronger coordination between government agencies and private industry.
Subramanyam stressed that public funding alone would not be sufficient to finance the 500 GW target. Creating a commercially viable investment environment that attracts private capital at scale will therefore remain a central priority.
A Defining Opportunity for India’s Green Economy
The estimated $220 billion investment pipeline highlights the growing economic significance of India’s clean energy transition. Beyond expanding renewable electricity generation, the opportunity could strengthen domestic manufacturing, encourage innovation, attract foreign investment and generate employment across multiple sectors.
The challenge will be to convert the projected investment potential into financially viable projects, reliable infrastructure and measurable progress towards decarbonisation.
- 0
- By Neel Achary

24, Oct 2026
Siwan Blast: Fire in Firecracker Stock Triggered Deadly Chain of Explosions
Bihar, Oct 24: A massive explosion at a house in Alampur village, Bihar’s Siwan district, was triggered after firecrackers stored inside caught fire, setting off successive blasts that destroyed part of the building and killed several people. The death toll was initially reported as four but later rose to five, with authorities warning it could increase further.

Representational Image
What happened
The blast occurred around 5:30 pm on Friday in Alampur village, under the Jamo Bazar police station area. Preliminary police information indicates that a fire broke out among firecrackers kept inside the house-cum-manufacturing unit, causing the initial explosion and then igniting other stored material.
Witnesses said the explosions continued intermittently for nearly two hours as flames spread through the stockpile. The force of the blasts brought down part of the structure, scattering debris on to the road and complicating rescue efforts.
Casualties and rescue
Siwan Superintendent of Police Bharat Soni initially confirmed four deaths, while the district administration said the final count could not be verified immediately because bodies were badly damaged and identification was under way. Later, the SP said the Civil Surgeon’s medical team had confirmed five bodies recovered from the site.
Several people were feared trapped under the debris, and reports said three people remained unaccounted for in the immediate aftermath. Rescue teams worked through the site as repeated detonations hampered operations.
The suspected trigger
Officials believe the immediate cause was a fire in the firecracker stock, rather than a single deliberate explosion. Once the first firecrackers ignited, the flames reportedly reached other material stored in the premises, producing a chain of explosions.
The unit was operating from the house of Mohammad Amiruddin Mian, described locally as a firecracker trader. While some early reports described the unit as licensed, later police statements and reports characterised the manufacturing activity as illegal or unlicensed; the exact licensing status remains part of the investigation.
Official response
Siwan District Magistrate Vijay Prakash Meena and SP Bharat Soni visited the site to supervise rescue and investigation. Authorities have also taken action over alleged negligence, with reports saying two police personnel were suspended in connection with the incident.
Police said an investigation will establish whether safety norms were violated, how large the stockpile was, and who was responsible for operating the unit from a residential property. The final casualty count and forensic findings are awaited.
23, Oct 2026
Philip Morris International Reports 2026 Third-Quarter & First Nine-Months Results and Updates 2026 Full-Year Adjusted Diluted EPS Forecast for Currency Only
Third-Quarter Reported Diluted EPS declined by 4.9% to $2.12;
Adjusted Diluted EPS grew by 5.4% to $2.36; and by 5.8% excluding currency
STAMFORD, Conn. and NEW DELHI, Oct. 23, 2026 /PRNewswire/ — Philip Morris International Inc. (PMI) (NYSE: PM) today announces its 2026 third-quarter results.1
“We delivered another excellent quarter, with growing total volumes, double-digit organic operating income growth and robust margin expansion,” said Jacek Olczak, Group CEO, PMI.
“With continued strong offtake momentum for our smoke-free brands and the exceptional results of our combustible business, we are in a strong position to continue delivering best-in-class performance, and firmly on track for a sixth consecutive year of volume growth.”
1 Explanation of PMI’s use of non-GAAP measures cited in this document and reconciliations to the most directly comparable U.S. GAAP measures can be found in the “Non-GAAP Measures, Glossary and Explanatory Notes” section of this release, in Exhibit 99.2 to the company’s Form 8-K dated October 21, 2026, and here.
Results Highlights – Third Quarter 2026
Shipments increased by 0.6% in the quarter, driven by a 2.7% increase in smoke-free products (SFP), with shipment growth across all categories, supported by high single-digit growth in SFP adjusted in-market sales (IMS), which is the closest proxy to consumer offtake. This was complemented by the continuing resilience of the combustible segment, notably in markets where SFPs are banned or have a limited market presence.
Net revenues increased by 5.5% (7.1% organically) to $11.4 billion, with growth across both smoke-free (up by 4.1%, 6.3% organically) and combustibles (up by 6.4%, 7.7% organically). Our smoke-free business accounted for more than 40% of total net revenues in the third quarter, and around 42% on a year-to-date basis, with more than 30 markets above 50%. PMI smoke-free products are now available in 110 markets.
Gross profit increased by 6.7% (8.3% organically), expanding gross margins through strong combustible pricing, scale and SFP mix benefits. Operating income increased by 14.1% (10.5% organically), reflecting the underlying strength of the business. This strong financial performance represents a new record quarterly high of net revenue, gross profit and operating income for the group.
Reported diluted EPS of $2.12 declined by 4.9%, mainly due to the non-cash fair value adjustment for equity security investments. Adjusted diluted EPS grew by 5.4%, or by 5.8% excluding a one cent unfavorable currency impact to reach $2.36, another quarterly all-time high.
International Smoke-Free Segment
Net revenue growth of 0.7% (3.4% organically) was driven by 2.7% volume growth, against the backdrop of a challenging HTU comparison due to the phasing of shipments between periods, notably in Japan. Strong adjusted IMS momentum continued, with an acceleration to 8.0% growth. Gross profit grew by 0.8% (3.3% organically).
Heat-not-burn SFP: IQOS continued to lead the growth of the global category, in which PMI holds around three-quarters of HTU volume share. IQOS HTUs gained 1.0pp to reach 9.9% of combined cigarette and HTU industry volumes in markets where present and grew shipment volumes by 1.5% to 41.5 billion units, at the high end of our previously disclosed expectations. HTU adjusted IMS grew by 7.1%. Excluding Japan and Poland, adjusted IMS continued to grow in the double digits, increasing by 10%, reflecting broad-based growth across a variety of markets, underscoring the increasing geographic diversification of IQOS.
- In Japan, PMI HTU adjusted IMS grew by 3.4%, or by 1.3% excluding the estimated consumer pantry-loading impact ahead of the October 1 excise-driven price increase (JPY20 per pack). This continues to be broadly in line with our expectations as consumers adjust following the first excise-driven price increase (JPY40 per pack) on April 1. IQOS maintained a strong category share at 68%, with SENTIA continuing to play a key role in capturing price-sensitive TEREA consumers.
- In Europe, IQOS HTU adjusted IMS growth strengthened to an estimated 6.0%, notwithstanding ongoing disruptions in Ukraine and the continued impact of the characterizing flavor ban in Poland. IQOS HTU adjusted market share increased by 0.9pp to 11.6%. This growth was led by strong performance in many markets, notably Germany, Greece, Spain and Romania. Adjusted IMS in Italy continued its strong growth trajectory, underscoring the category’s significant potential across the region. Excluding Poland, adjusted IMS volumes grew by around 8%.
- Outside Europe and Japan, adjusted IMS grew by 12.7% and offtake share increased in key cities across the globe, including Riyadh, Kuala Lumpur, Mexico City, Jakarta and Taipei, underlining the global growth potential of the heat-not-burn category.
Oral SFP: Total oral SFP volumes turned positive, increasing by 0.5%, as growth in modern oral of 20.6% to 0.5 billion pouches more than offset declines in the legacy Nordic snus business. We continue to expand ZYN‘s footprint, with ZYN now available in 62 international markets and showing promising growth in geographies such as Global Travel Retail, Poland, and the Philippines, as well as sequential improvements in Sweden.
E-vapor SFP: We continue to drive outstanding growth in VEEV, with quarterly shipments up by 61.6%. VEEV further reinforced its leadership position in Europe, with strong growth across a range of markets, notably Romania, Greece, France and Spain. VEEV is also demonstrating promising results in markets outside of Europe, such as Indonesia, Global Travel Retail, Egypt, Malaysia and South Korea following the launch in August. PMI remains committed to building and commercializing the brand in a focused, responsible and profitable manner, leveraging its key role as part of our multicategory portfolio.
International Combustibles Segment
The combustibles segment delivered an exceptional quarter, with cigarette volume continuing to show strong resilience with broadly flat shipments. This was notably due to strong growth in markets such as Turkey, Indonesia and Egypt, which offset declines in other markets. Net revenues grew by 6.5% (7.8% organically), driven by another impressive quarter of 8.9% pricing, partly offset by geographic mix. This quarter also benefited from the favorable restructuring of distribution terms in certain markets, which is not expected to recur at the same level in future quarters. Gross profit grew by 8.6% (9.8% organically). Our cigarette category volume share stood at 25.9% (up by 0.4pp) despite adverse market mix. Marlboro continued to gain share (up by 0.5pp) reaching a record category share of 11.4%.
U.S. Segment
In the U.S., total ZYN shipments grew by 4.2% to 3.2 billion pouches, despite challenging comparisons against a special promotional campaign last year and supported by the ongoing launches of ZYN ULTRA, new flagship dry flavors, 1.5mg and 8mg flagship variants. These portfolio extensions enable ZYN to cover a broader range of consumer preferences and compete in the most dynamic growing segments of the category. Segment net revenues grew by 22.7% and gross profit by 24.2% (23.8% organically), driven by volume growth combined with favorable pricing comparisons due to prior year promotional activities. Operating companies income decreased by 3.3% (increased by 1.5% organically), including a significant increase in commercial investments to support the expansion of our ZYN portfolio, which increased its category share by over 100 basis points between June and September, as estimated by Nielsen.
As part of our previously announced plans to accelerate investments in the second half, and with distribution of the extended range of ZYN products continuing to progress, we plan to further increase investments to support the brand in the fourth quarter. This reflects a ramp-up in consumer communications, notably an expansion of the ‘When It Clicks‘ brand campaign, and the transition of the majority of the ZYN flagship portfolio to 20-pouch cans (from 15-pouch cans today), including associated transitional support programs. The change to 20-pouch cans is designed to align the value proposition across the portfolio and optimize ZYN’s price premium to support future growth in the dynamic U.S. nicotine pouch category.
On August 21, the FDA granted PMTA authorization to 11 variants of ZYN ULTRA, our higher-nicotine moist offering. ZYN now has PMTA authorization of 31 variants in total, more than any other nicotine brand on the market. This, combined with the MRTP authorization of 20 ZYN flagship variants on June 30, underlines the robustness of the science behind our products and their potential to reduce the harm caused by smoking.
Dividend: Increased regular quarterly dividend by 8.8% to $1.60 per share, or an annualized $6.40 per share.
|
Third-Quarter 2026 Performance Highlights |
||||||||||||||||
|
Shipment Volume |
PMI |
International |
International |
U.S. |
||||||||||||
|
Q3 |
vs. PY |
Q3 |
vs. PY |
Q3 |
vs. PY |
Q3 |
vs. PY |
|||||||||
|
Total |
206.2 |
0.60 % |
44.5 |
2.70 % |
158.0 |
— % |
3.7 |
2.30 % |
||||||||
|
Cigarettes |
158.0 |
— % |
158.0 |
— % |
||||||||||||
|
SFP |
48.2 |
2.70 % |
44.5 |
2.70 % |
3.7 |
2.30 % |
||||||||||
|
HTU |
41.5 |
1.50 % |
41.5 |
1.50 % |
– |
(14.30) % |
||||||||||
|
Oral SFP |
5.3 |
1.80 % |
1.6 |
0.50 % |
3.7 |
2.30 % |
||||||||||
|
E-Vapor |
1.4 |
61.60 % |
1.4 |
61.60 % |
||||||||||||
|
“-” indicates zero volumes or less than 50 million units |
||||||||||||||||
|
PMI |
International |
International |
U.S. |
|||||||||||||
|
Net Revenues ($ bn) |
$11.4 |
$3.9 |
$6.7 |
$0.8 |
||||||||||||
|
reported vs. Q3 2025 |
5.50 % |
0.70 % |
6.50 % |
22.70 % |
||||||||||||
|
organic vs. Q3 2025 |
7.10 % |
3.40 % |
7.80 % |
22.70 % |
||||||||||||
|
Gross Profit ($ bn) |
$7.9 |
$2.7 |
$4.6 |
$0.5 |
||||||||||||
|
reported vs. Q3 2025 |
6.70 % |
0.80 % |
8.60 % |
24.20 % |
||||||||||||
|
organic vs. Q3 2025 |
8.30 % |
3.30 % |
9.80 % |
23.80 % |
||||||||||||
|
OCI ($ bn) |
$4.9 |
$4.9 |
$— |
|||||||||||||
|
reported vs. Q3 2025 |
13.00 % |
12.90 % |
(3.30) % |
|||||||||||||
|
organic vs. Q3 2025 |
10.50 % |
10.80 % |
1.50 % |
|||||||||||||
|
Operating Income ($ bn) |
$4.9 |
|||||||||||||||
|
reported vs. Q3 2025 |
14.10 % |
|||||||||||||||
|
organic vs. Q3 2025 |
10.50 % |
|||||||||||||||
|
Note: Sums might not foot to total due to rounding. |
||||||||||||||||
|
2026 |
2025 |
Change |
||||||||||||||
|
Reported Diluted EPS |
$2.12 |
$2.23 |
(4.90) % |
|||||||||||||
|
Amortization of intangibles |
0.13 |
0.13 |
||||||||||||||
|
Fair value adjustment for equity security investments |
0.06 |
(0.07) |
||||||||||||||
|
Income tax impact associated with Swedish Match AB financing |
0.01 |
– |
||||||||||||||
|
Dutch pension plan buy-out loss |
0.04 |
– |
||||||||||||||
|
Germany excise tax classification litigation charge |
– |
0.1 |
||||||||||||||
|
RBH (Canada) Plan Implementation, including dividend income, net |
– |
(0.10) |
||||||||||||||
|
Impairment of Wellness business related equity investment |
– |
0.09 |
||||||||||||||
|
Tax items |
– |
(0.14) |
||||||||||||||
|
Adjusted Diluted EPS |
$2.360 |
$2.24 |
5.40 % |
|||||||||||||
|
Less: Currency |
(0.01) |
|||||||||||||||
|
Adjusted Diluted EPS, excluding Currency |
$2.37 |
$2.24 |
5.80 % |
|||||||||||||
|
First Nine-Months 2026 Performance Highlights |
||||||||||||||||
|
Shipment Volume (billion equivalent units) |
PMI |
International |
International |
U.S. |
||||||||||||
|
YTD |
vs. PY |
YTD |
vs. PY |
YTD |
vs. PY |
YTD |
vs. PY |
|||||||||
|
Total |
595.6 |
0.50 % |
133.3 |
7.40 % |
452.2 |
(1.20) % |
10.1 |
(5.80) % |
||||||||
|
Cigarettes |
452.2 |
(1.20) % |
452.2 |
(1.20) % |
||||||||||||
|
SFP |
143.4 |
6.40 % |
133.3 |
7.40 % |
10.1 |
(5.80) % |
||||||||||
|
HTU |
124.5 |
6.70 % |
124.5 |
6.70 % |
– |
+100 % |
||||||||||
|
Oral SFP |
14.9 |
(5.30) % |
4.8 |
(4.00) % |
10.0 |
(5.80) % |
||||||||||
|
E-Vapor |
4.0 |
68.10 % |
4.0 |
68.10 % |
||||||||||||
|
“-” indicates zero volumes or less than 50 million units |
||||||||||||||||
|
PMI |
International |
International |
U.S. |
|||||||||||||
|
Net Revenues ($ bn) |
$32.8 |
$11.6 |
$18.9 |
$2.3 |
||||||||||||
|
reported vs. YTD 2025 |
8.20 % |
12.30 % |
7.70 % |
(5.20) % |
||||||||||||
|
organic vs. YTD 2025 |
5.90 % |
9.90 % |
5.20 % |
(5.50) % |
||||||||||||
|
Gross Profit ($ bn) |
$22.4 |
$8.1 |
$12.8 |
$1.5 |
||||||||||||
|
reported vs. YTD 2025 |
9.40 % |
14.30 % |
9.90 % |
(14.80) % |
||||||||||||
|
organic vs. YTD 2025 |
7.10 % |
11.80 % |
7.40 % |
(14.60) % |
||||||||||||
|
OCI ($ bn) |
$13.6 |
$13.7 |
$(0.1) |
|||||||||||||
|
reported vs. YTD 2025 |
13.40 % |
17.60 % |
-(100) % |
|||||||||||||
|
organic vs. YTD 2025 |
7.60 % |
11.40 % |
(41.10) % |
|||||||||||||
|
Operating Income ($ bn) |
$13.3 |
|||||||||||||||
|
reported vs. YTD 2025 |
15.40 % |
|||||||||||||||
|
organic vs. YTD 2025 |
7.70 % |
|||||||||||||||
|
Note: Sums might not foot to total due to rounding. |
||||||||||||||||
|
2026 |
2025 |
Change |
||||||||||||||
|
Reported Diluted EPS |
$5.48 |
$5.89 |
(7.00) % |
|||||||||||||
|
Amortization of intangibles |
0.37 |
0.37 |
||||||||||||||
|
Fair value adjustment for equity security investments |
0.22 |
(0.33) |
||||||||||||||
|
Restructuring charges |
0.02 |
0.13 |
||||||||||||||
|
Income tax impact associated with Swedish Match AB financing |
0.07 |
(0.24) |
||||||||||||||
|
Impairment related to the RBH equity investment |
0.33 |
– |
||||||||||||||
|
Egypt sales tax settlement adjustment |
(0.01) |
– |
||||||||||||||
|
Dutch pension plan buy-out loss |
0.04 |
– |
||||||||||||||
|
Impairment of goodwill |
– |
0.03 |
||||||||||||||
|
Germany excise tax classification litigation charge |
– |
0.1 |
||||||||||||||
|
RBH (Canada) Plan Implementation, including dividend income, net |
– |
(0.10) |
||||||||||||||
|
Impairment of Wellness business related equity investment |
– |
0.09 |
||||||||||||||
|
Tax items |
– |
(0.11) |
||||||||||||||
|
Adjusted Diluted EPS |
$6.52 |
$5.83 |
11.80 % |
|||||||||||||
|
Less: Currency |
0.2 |
|||||||||||||||
|
Adjusted Diluted EPS, excluding Currency |
$6.32 |
$5.83 |
8.40 % |
|||||||||||||
Impact of Geopolitical Conflicts
While the impact of the ongoing Middle East conflict on the group remains manageable, it has had an increasing effect on our business, with energy-related inflation driving incremental cost pressures in the third quarter. In our full-year forecast, we assume the observed rise in energy-related input prices to have a slightly higher impact in the fourth quarter, as a larger proportion of input price increases take effect. The long-term situation remains unpredictable, and it is difficult to assess the broader implications for consumers or the global cost environment.
In addition, the evolution of the situation in Ukraine has caused certain disruptions to our business this year, including the impact of strikes on our supply chain and logistics infrastructure in certain locations. We expect this disruption to have an impact on our operating income this year.
|
2026 Full-Year Forecast |
||||||
|
2026 |
2025 |
Growth |
||||
|
Reported Diluted EPS |
$7.11 – $7.26 |
$ 7.26 |
||||
|
Adjustments |
||||||
|
Amortization of intangibles |
0.50 |
0.50 |
||||
|
Fair value adjustment for equity security investments |
0.22 |
(0.18) |
||||
|
Restructuring charges |
0.03 |
0.14 |
||||
|
Income tax impact associated with Swedish Match AB financing |
0.07 |
(0.25) |
||||
|
Impairment related to the RBH equity investment |
0.33 |
— |
||||
|
Egypt sales tax settlement adjustment |
(0.01) |
— |
||||
|
Dutch pension plan buy-out loss |
0.04 |
— |
||||
|
Other 2025 adjustments(1) |
— |
0.07 |
||||
|
Total Adjustments |
1.18 |
0.28 |
||||
|
Adjusted Diluted EPS |
$8.29 – $8.44 |
$ 7.54 |
9.9% – 11.9% |
|||
|
Less: Currency |
0.18 |
|||||
|
Adjusted Diluted EPS, excluding currency |
$8.11 – $8.26 |
$ 7.54 |
7.5% – 9.5% |
|||
|
(1) Includes: $0.10 Germany excise tax classification litigation charge; ($0.10) RBH (Canada) Plan Implementation, including dividend income, net; $0.09 |
||||||
Reported diluted EPS is forecast to be in a range of $7.11 to $7.26, at prevailing exchange rates. Excluding a total 2026 adjustment of $1.18 per share, this forecast represents a projected increase of 9.9% to 11.9% versus adjusted diluted EPS of $7.54 in 2025. This includes a favorable currency impact of $0.18, at prevailing exchange rates (previously $0.24). Excluding currency, this forecast represents a projected increase of 7.5% to 9.5% versus adjusted diluted EPS of $7.54 in 2025, as outlined in the above table.
2026 Full-Year Forecast Assumptions
- Growing (previously broadly stable to slightly growing) total PMI cigarette and SFP shipment volume, with high single-digit SFP shipment growth, led by high single-digit SFP adjusted IMS growth, and a cigarette shipment volume decline at a similar level to the year-to-date trend (previously around 2% to 3%);
- Net revenue growth of 5% to 7% on an organic basis; with a greater likelihood to be in the middle or upper-half of the range, supported by a fourth-quarter reacceleration in international smoke-free;
- Organic operating income growth of 7% to 9%; with a greater likelihood to be in the middle or lower-half of the range, with a corresponding flow through to our EPS forecast range, given the cost impacts of ongoing geopolitical tensions and the previously communicated step-up in U.S. growth investments;
- Full-year amortization of acquired intangibles of $0.50 per share;
- Broadly stable net financing costs;
- An effective tax rate, excluding discrete tax events, of around 21.5%;
- Operating cash flow around $13.5 billion at prevailing exchange rates, subject to year-end working capital requirements;
- Capital expenditures of $1.4 to $1.6 billion, predominantly supporting the smoke-free business;
- Further net debt to adjusted EBITDA ratio improvement as we target a ratio of close to 2.0x by the end of 2026, at prevailing exchange rates; and
- No share repurchases.
Factors described in the Forward-Looking and Cautionary Statements section of this release represent continuing risks to these projections.
|
Third-Quarter 2026 Operating Review |
||||||||
|
Net Revenues |
PMI |
International |
International |
U.S. |
||||
|
2025 |
$10,845 |
$3,839 |
$6,316 |
$689 |
||||
|
Price |
739 |
21 |
565 |
153 |
||||
|
Volume/Mix/Other |
36 |
108 |
(75) |
4 |
||||
|
Acquisitions & Divestitures |
(27) |
(27) |
— |
— |
||||
|
Currency |
(155) |
(74) |
(81) |
(1) |
||||
|
2026 |
$11,438 |
$3,867 |
$6,725 |
$845 |
||||
|
vs. Q3 2025 |
5.50 % |
0.7 % |
6.5 % |
22.7 % |
||||
|
Organic growth |
7.10 % |
3.4 % |
7.8 % |
22.7 % |
||||
|
Gross Profit |
PMI |
International |
International |
U.S. |
||||
|
2025 |
$7,361 |
$2,683 |
$4,244 |
$434 |
||||
|
Price |
739 |
21 |
565 |
153 |
||||
|
Volume/Mix/Other |
(23) |
87 |
(99) |
(9) |
||||
|
Cost |
(104) |
(18) |
(48) |
(39) |
||||
|
Acquisitions & Divestitures |
(7) |
(7) |
— |
— |
||||
|
Currency |
(112) |
(60) |
(52) |
— |
||||
|
2026 |
$7,854 |
$2,705 |
$4,610 |
$539 |
||||
|
vs. Q3 2025 |
6.70 % |
0.80 % |
8.60 % |
24.20 % |
||||
|
Adjustments* |
6 |
1 |
— |
5 |
||||
|
2026 Adjusted Gross Profit |
$7,860 |
$2,705 |
$4,610 |
$544 |
||||
|
vs. Q3 2025 |
6.70 % |
0.80 % |
8.60 % |
23.90 % |
||||
|
Organic growth |
8.30 % |
3.30 % |
9.80 % |
23.80 % |
||||
|
2026 Adj. Gross Profit Margin |
68.70 % |
70.00 % |
68.50 % |
64.40 % |
||||
|
vs. Q3 2025 |
0.8pp |
0.1pp |
1.3pp |
0.7pp |
||||
|
Organic growth |
0.8pp |
—pp |
1.3pp |
0.6pp |
||||
|
(*) For a list of adjusting items refer to the “Non-GAAP Measures, Glossary and Explanatory Notes” section of this release, in Exhibit |
||||||||
|
PMI (in millions) |
Variance |
|||||||||||||||||
|
2026 |
2025 |
Change |
Total |
Price |
Volume / |
Cost |
Acq. / |
Currency |
||||||||||
|
Net Revenues |
11,438 |
10,845 |
5.50 % |
593 |
739 |
36 |
– |
(27) |
(155) |
|||||||||
|
Cost of Sales (1) |
(3,584) |
(3,484) |
(2.90) % |
(100) |
– |
(59) |
(104) |
20 |
43 |
|||||||||
|
Gross Profit |
7,854 |
7,361 |
6.70 % |
493 |
739 |
(23) |
(104) |
(7) |
(112) |
|||||||||
|
Marketing, Administration and Research Costs (2) |
(2,993) |
(3,058) |
2.10 % |
65 |
– |
– |
40 |
4 |
21 |
|||||||||
|
Corporate Expenses & Other |
5 |
(40) |
+100 % |
45 |
– |
– |
(7) |
– |
52 |
|||||||||
|
Operating Income |
4,866 |
4,263 |
14.10 % |
603 |
739 |
(23) |
(71) |
(3) |
(39) |
|||||||||
|
Adjustments* |
(251) |
(407) |
38.30 % |
156 |
– |
– |
156 |
– |
– |
|||||||||
|
Adj. Operating Income |
5,117 |
4,670 |
9.60 % |
447 |
739 |
(23) |
(227) |
(3) |
(39) |
|||||||||
|
Adj. OI Margin |
44.70 % |
43.10 % |
1.6pp |
|||||||||||||||
|
(1) Includes $6 million in 2026 and $5 million in 2025 related to the adjusting items shown below Operating Income |
||||||||||||||||||
|
(2) Includes $245 million in 2026 and $402 million in 2025 related to the adjusting items shown below Operating Income |
||||||||||||||||||
|
(*) For a list of adjusting items refer to Exhibit 99.2 to the company’s Form 8-K dated October 21, 2026. |
||||||||||||||||||
|
Note: Sums might not foot to total due to rounding. |
||||||||||||||||||
Total PMI
- Estimated industry volume (excluding China and the U.S.) for cigarettes and HTUs was broadly stable, decreasing by 0.1%.
- Net revenues increased by 7.1% organically, mainly reflecting: a favorable pricing variance driven by international combustibles and the U.S. segment.
- Operating income increased by 10.5% on an organic basis, largely reflecting the same factors as for net revenues.
International Smoke-Free Segment
- Shipment volume grew by 2.7%, with broad-based growth across markets, notably Taiwan, Global Travel Retail, Greece, Germany, and Bulgaria, notwithstanding a challenging HTU comparison due to phasing of shipments between periods.
- Net revenues increased by 3.4% on an organic basis, reflecting: a favorable volume/mix driven by higher HTU and e-vapor volumes and a favorable pricing variance due to HTUs.
- Gross profit increased by 3.3% organically mainly due to the same factors as for net revenues.
International Combustibles Segment
- Shipment volumes were broadly flat with notable increases in Turkey, Indonesia, and Egypt, offsetting declines in markets such as Russia, Poland and Japan.
- Net revenues increased by 7.8% on an organic basis, reflecting: a favorable pricing variance, the restructuring of distribution terms in certain markets, and partially offset by unfavorable geographic mix.
- Gross profit increased by 9.8% organically due to the same factors as for net revenues, slightly offset by higher costs due to increases in energy-related input prices.
U.S. Segment
- Net revenues increased by 22.7%, primarily reflecting: growing ZYN shipments of 4.2%, and a favorable price variance against prior year promotions, supported by growth in the Wellness business and cigars.
- Gross profit increased by 23.8% on an organic basis reflecting the same factors as for net revenues, partly offset by higher manufacturing costs linked to the expansion of our footprint.
- Adjusted OCI increased by 1.5% organically, to $171 million, reflecting the same factors as for adjusted gross profit and the start of increased marketing investments to support the expanded ZYN portfolio.
|
First Nine-Months 2026 Operating Review – Net Revenues |
||||
|
(in millions) |
PMI |
International |
International |
U.S. |
|
2025 |
$30,286 |
$10,310 |
$17,525 |
$2,451 |
|
Price |
1,889 |
195 |
1,607 |
88 |
|
Volume/Mix/Other |
(89) |
823 |
(689) |
(222) |
|
Acquisitions & Divestitures |
(44) |
(44) |
— |
— |
|
Currency |
734 |
297 |
429 |
8 |
|
2026 |
$32,776 |
$11,580 |
$18,872 |
$2,324 |
|
vs. YTD 2025 |
8.2 % |
12.3 % |
7.7 % |
(5.2) % |
|
Organic growth |
5.9 % |
9.9 % |
5.2 % |
(5.5) % |
|
Gross Profit |
PMI |
International |
International |
U.S. |
||||
|
2025 |
$20,497 |
$7,088 |
$11,679 |
$1,729 |
||||
|
Price |
1,889 |
195 |
1,607 |
88 |
||||
|
Volume/Mix/Other |
(261) |
575 |
(621) |
(214) |
||||
|
Cost |
(179) |
65 |
(116) |
(128) |
||||
|
Acquisitions & Divestitures |
(11) |
(11) |
— |
— |
||||
|
Currency |
483 |
194 |
290 |
(1) |
||||
|
2026 |
$22,418 |
$8,105 |
$12,839 |
$1,473 |
||||
|
vs. YTD 2025 |
9.4 % |
14.3 % |
9.9 % |
(14.8) % |
||||
|
Adjustments* |
18 |
2 |
— |
16 |
||||
|
2026 Adjusted Gross Profit |
$22,436 |
$8,107 |
$12,839 |
$1,489 |
||||
|
vs. YTD 2025 |
9.4 % |
14.3 % |
9.9 % |
(14.6) % |
||||
|
Organic growth |
7.1 % |
11.8 % |
7.4 % |
(14.6) % |
||||
|
2026 Adj. Gross Profit Margin |
68.5 % |
70.0 % |
68.0 % |
64.1 % |
||||
|
vs. YTD 2025 |
0.8pp |
1.2pp |
1.4pp |
(7.1)pp |
||||
|
Organic growth |
0.8pp |
1.2pp |
1.4pp |
(6.9)pp |
||||
|
(*) For a list of adjusting items refer to the “Non-GAAP Measures, Glossary and Explanatory Notes” section of this release, in Exhibit |
||||||||
|
PMI (in millions) |
Variance |
|||||||||||||||||
|
2026 |
2025 |
Change |
Total |
Price |
Volume / |
Cost |
Acq. / Divest. |
Currency |
||||||||||
|
Net Revenues |
32,776 |
30,286 |
8.20 % |
2,490 |
1,889 |
(89) |
– |
(44) |
734 |
|||||||||
|
Cost of Sales (1) |
(10,358) |
(9,789) |
(5.80) % |
(569) |
– |
(172) |
(179) |
33 |
(251) |
|||||||||
|
Gross Profit |
22,418 |
20,497 |
9.40 % |
1,921 |
1,889 |
(261) |
(179) |
(11) |
483 |
|||||||||
|
Marketing, Administration and Research Costs (2) |
(8,831) |
(8,474) |
(4.20) % |
(357) |
– |
– |
(76) |
6 |
(287) |
|||||||||
|
Impairment of Goodwill |
— |
(41) |
+100 % |
41 |
– |
– |
41 |
– |
– |
|||||||||
|
Corporate Expenses & Other |
(298) |
(463) |
35.60 % |
165 |
– |
– |
(18) |
– |
183 |
|||||||||
|
Operating Income |
13,289 |
11,519 |
15.40 % |
1,770 |
1,889 |
-261 |
-232 |
-5 |
379 |
|||||||||
|
Adjustments* |
(769) |
(1,187) |
35.20 % |
418 |
– |
– |
418 |
– |
– |
|||||||||
|
Adj. Operating Income |
14,058 |
12,706 |
10.60 % |
1,352 |
1,889 |
(261) |
(650) |
(5) |
379 |
|||||||||
|
Adj. OI Margin |
42.90 % |
42.00 % |
0.9pp |
|||||||||||||||
|
(1) Includes $18 million in 2026 and $16 million in 2025 related to the adjusting items shown below Operating Income |
||||||||||||||||||
|
(2) Includes $751 million in 2026 and $1,130 million in 2025 related to the adjusting items shown below Operating Income |
||||||||||||||||||
|
(*) For a list of adjusting items refer to the “Non-GAAP Measures, Glossary and Explanatory Notes” section of this release, in Exhibit 99.2 to the company’s Form 8-K dated October 21, 2026 |
||||||||||||||||||
|
Note: Sums might not foot to total due to rounding. |
||||||||||||||||||
Total PMI
- Estimated industry volume (excluding China and the U.S.) for cigarettes and HTUs declined by 0.4%.
- Net revenues increased by 5.9% organically, mainly reflecting: a favorable pricing variance mainly driven by international combustibles; higher international smoke-free volumes; partly offset by unfavorable volume/mix, mainly driven by lower international combustibles and U.S. volumes in the first quarter.
- Operating income increased by 7.7% on an organic basis, reflecting the same factors as for net revenues, partially offset by higher marketing, administration and research costs.
International Smoke-Free Segment
- Shipment volume grew by 7.4%, notably due to Taiwan, Greece, Italy, and Global Travel Retail.
- Net revenues increased by 9.9% on an organic basis, reflecting: a favorable volume/mix driven by higher HTU and e-vapor volumes and a favorable pricing variance due to higher HTU pricing.
- Gross profit increased by 11.8% organically mainly due to the same factors as for net revenues, supported by favorable manufacturing efficiencies.
International Combustibles Segment
- Shipment volume declined by 1.2% with notable decreases in Russia, Mexico, and Germany, partly offset by Turkey and Egypt.
- Net revenues increased by 5.2% on an organic basis, reflecting: a favorable pricing variance and the previously mentioned restructuring of distribution terms in certain markets, partially offset by unfavorable volume/mix.
- Gross profit increased by 7.4% organically due to the same factors as for net revenues, and slightly offset by increases in energy-related input prices.
U.S. Segment
- Net revenues decreased by 5.5% organically, reflecting: unfavorable dynamics in the first quarter with ZYN volumes impacted by distributor and trade inventory movements, slightly offset by favorable price comparisons against higher promotional activities in the third quarter last year.
- Gross profit decreased by 14.6% on an organic basis reflecting the same factors as for net revenues and higher manufacturing costs.
- Adjusted OCI decreased by 41.1% organically, to $550 million, reflecting the same factors as for gross profit and increased investments in marketing, administration and research costs.
Conference Call
A conference call hosted by Massimo Andolina, Group Chief Financial Officer, will be webcast at 9:00 a.m., Eastern Time, on October 21, 2026. The webcast can be accessed here. Further market data will be provided in an appendix to the webcast presentation.
Philip Morris International: A Global Smoke-Free Champion
Philip Morris International is a leading international consumer goods company, actively delivering a smoke-free future and evolving its portfolio for the long term to include products outside of the tobacco and nicotine sector. The company’s current product portfolio primarily consists of cigarettes and smoke-free products, including heat-not-burn, nicotine pouch and e-vapor products. Our smoke-free products are available for sale in 110 markets as of September 30, 2026. As of December 31, 2025 PMI estimates they were used by over 43 million legal-age consumers around the world, many of whom have moved away from cigarettes or significantly reduced their consumption. The smoke-free business accounted for more than 40% of PMI’s third-quarter 2026 total net revenues. Since 2008, PMI has invested over $16 billion to develop, scientifically substantiate and commercialize innovative smoke-free products for legal-age adults who would otherwise smoke or use other nicotine-containing consumer products, with the goal of completely ending the sale of cigarettes. This includes the building of world-class scientific assessment capabilities, notably in the areas of pre-clinical systems toxicology, clinical and behavioral research, as well as post-market studies. Following a robust science-based review, the U.S. Food and Drug Administration has authorized the marketing of Swedish Match’s General snus and ZYN nicotine pouches and versions of PMI’s IQOS devices and consumables – the first-ever such authorizations in their respective categories. Versions of IQOS devices and consumables, General snus and 20 ZYN nicotine pouch variants also obtained the first-ever Modified Risk Tobacco Product authorizations from the FDA. With a strong foundation and significant expertise in life sciences, PMI has a long-term ambition to expand into wellness areas. References to “PMI”, “we”, “our” and “us” mean Philip Morris International Inc., and its subsidiaries. For more information, please visit www.pmi.com and www.pmiscience.com.
Forward-Looking and Cautionary Statements
This release contains projections of future results and goals and other forward-looking statements, including statements regarding expected financial or operational performance; capital allocation plans; investment strategies; regulatory outcomes; market expectations; business plans and strategies. Achievement of future results is subject to risks, uncertainties and inaccurate assumptions. In the event that risks or uncertainties materialize, or underlying assumptions prove inaccurate, actual results could vary materially from those contained in such forward-looking statements. Pursuant to the “safe harbor” provisions of the Private Securities Litigation Reform Act of 1995, PMI is identifying important factors that, individually or in the aggregate, could cause actual results and outcomes to differ materially from those contained in any forward-looking statements made by PMI.
PMI’s business risks include: marketing and regulatory restrictions that could reduce our competitiveness, disrupt our SFP commercialization efforts, eliminate our ability to communicate with adult consumers, or ban certain of our products in certain markets or countries; excise tax increases and discriminatory tax structures; health concerns relating to the use of tobacco and other nicotine-containing products; litigation related to tobacco and/ or nicotine products and intellectual property rights; intense competition; inability to anticipate changes in adult consumer preferences; use and reliance on third-parties; the adverse effects of global and individual country economic, regulatory and political developments, natural disasters and conflicts; geopolitical instability; the impact and consequences of Russia’s invasion of Ukraine; changes in legal-age adult smoker behavior; continued decline of tax-paid cigarettes; lost revenues as a result of counterfeiting, contraband and cross-border purchases; governmental investigations; unfavorable currency exchange rates and currency devaluations, sustained periods of elevated inflation, and limitations on the ability to repatriate funds; adverse changes in applicable corporate tax laws; disruptions in the credit markets or changes to its credit ratings; recent and potential future tariffs imposed by the U.S. and other countries; adverse changes in the cost, availability, and quality of tobacco and other agricultural products and raw materials, as well as product components for its electronic devices; and the integrity of its information systems and effectiveness of its data privacy policies. PMI’s future profitability may also be adversely affected should it be unsuccessful, in key markets or systemically, in its efforts to introduce, commercialize, and grow smoke-free products or if regulation or taxation do not differentiate between such products and cigarettes; if it is unable to successfully introduce new products, and promote brand equity; if there are prolonged disruptions of facilities used to produce its products; if it is unable to enter new markets or improve its margins through increased prices and productivity gains; if other market participants are more successful in their SFP commercialization efforts; if it is unable to attract and retain the best global talent; or if it is unable to successfully integrate and realize the expected benefits from recent transactions and acquisitions. Future results are also subject to the lower predictability of our smoke-free products performance.
PMI is further subject to other risks detailed from time to time in its publicly filed documents, including PMI’s Annual Report on Form 10-K for the fourth quarter and year ended December 31, 2025, and the Quarterly Report on Form 10-Q for the third quarter ended September 30, 2026, which will be filed in the coming days. PMI cautions that the foregoing list of important factors is not a complete discussion of all potential risks and uncertainties. PMI does not undertake to update any forward-looking statement that it may make from time to time, except in the normal course of its public disclosure obligations.
Non-GAAP Measures, Glossary and Explanatory Notes
Reconciliations of non-GAAP measures in this release to the most directly comparable U.S. GAAP measures can be found in Exhibit 99.2 to the Form 8-K dated October 21, 2026, and here. A glossary of key terms, definitions and explanatory notes is available in the aforementioned Exhibit 99.2 and on the same webpage, where additional financial schedules, as well as adjustments and other calculations have also been made available.
Management reviews net revenues, gross profit, operating companies income, operating income, operating cash flow and earnings per share, or “EPS,” on an adjusted basis, which may exclude the impact of currency and other items such as acquisitions, divestitures, restructuring costs, tax items and other adjusting items. Additionally, starting in 2022 and on a comparative basis, for these measures other than net revenues and operating cash flow, PMI includes adjustments to add back amortization expense on acquisition related intangible assets that are recorded as part of purchase accounting and contribute to PMI’s revenue generation, as well as impairment of intangible assets, if any. While amortization expense on acquisition related intangible assets is excluded in these adjusted measures, the net revenues generated from these acquired intangible assets are included in the company’s adjusted measures, unless otherwise stated. Currency-neutral and organic growth rates reflect the way management views underlying performance for these measures. PMI believes that such measures provide useful insight into underlying business trends and results. Management reviews these measures because they exclude changes in currency exchange rates and other factors that may distort underlying business trends, thereby improving the comparability of PMI’s business performance between reporting periods. Furthermore, PMI uses several of these measures in its management compensation program to promote internal fairness and a disciplined assessment of performance against company targets. PMI discloses these measures to enable investors to view the business through the eyes of management.
Non-GAAP measures used in this release should neither be considered in isolation nor as a substitute for the financial measures prepared in accordance with U.S. GAAP.
 View original content to download multimedia:https://www.prnewswire.com/in/news-releases/philip-morris-international-reports-2026-third-quarter–first-nine-months-results-and-updates-2026-full-year-adjusted-diluted-eps-forecast-for-currency-only-302918215.html

23, Oct 2026
GoDaddy Brings ‘Ink Your Link’ Campaign to NYC: NYSE Content Update
NYSE issues a pre-market daily advisory direct from the trading floor.
NEW YORK, Oct. 23, 2026 /PRNewswire/ — The New York Stock Exchange (NYSE) provides a daily pre-market update directly from the NYSE Trading Floor. Access today’s NYSE Pre-market update for market insights before trading begins.
Kristen Scholer delivers the pre-market update on October 23rd
- GoDaddy to open pop-up in Manhattan for entrepreneurs and consumers this weekend
- It will give small business owners the chance to get temporary tattoos inspired by their work.
- The larger ‘Ink Your Link’ campaign is designed to celebrate the courage and commitment it takes to build a business.
- GoDaddy (NYSE: GDDY) executives will join NYSE Live to provide more details about the campaign’s goals and its focus on small businesses.
- The 29th Annual Wall Street Project Economic Impact Summit takes place today at the NYSE
- ‘The Sports Investment Revolution: From Ownership to Ecosystem’ is the theme for this year’s event.
- It’s being organized by the Rainbow PUSH Coalition and the Citizenship Education Fund.
- NFL Alumni Association CEO Brad Edwards, an event participant, will join NYSE Live to discuss the evolution of athlete entrepreneurship.
- Nova Minerals to celebrate its recent transfer to NYSE American
- Nova says it has evolved from an exploration company into a development-stage resource firm.
- CEO Christopher Gerteisen will join NYSE Live to share the latest details on the Estelle Project in Alaska and highlight his company’s 2027 goals.
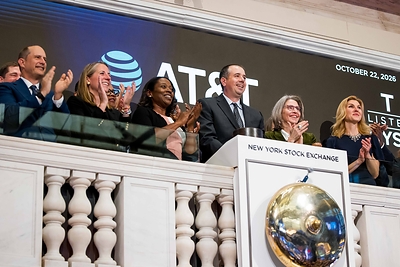
Opening Bell
Nova Minerals (NYSE American: NVA) celebrates its listing
Closing Bell
Rainbow PUSH Wall Street Project celebrates its 29th Annual Wall Street Project Economic Impact Summit.
For market insights, IPO activity, and today’s opening bell, download the NYSE TV App and check out the NYSE YouTube: TV.NYSE.com and YouTube.com/@NYSEofficial
 View original content to download multimedia:https://www.prnewswire.co.uk/news-releases/godaddy-brings-ink-your-link-campaign-to-nyc-nyse-content-update-302918091.html

23, Oct 2026
TCL Zhonghuan Powers India’s Energy Transition with PV Innovations at REI Expo 2026
GREATER NOIDA, India, Oct. 23, 2026 /PRNewswire/ — The Renewable Energy India Expo (REI) opened on October 22 at the India Expo Centre in Greater Noida. As one of South Asia’s major renewable energy industry events, this year’s exhibition has attracted companies and industry professionals from around the world. At Booth H16-A275, TCL Zhonghuan showcases a full lineup of high-performance solar products, including high-efficiency silicon wafers, TCL Solar PV modules, and BlueArk energy storage solutions.

India’s PV industry has continued to expand in recent years, with domestic solar cell and module manufacturing capacity growing steadily. Demand from utility-scale solar plants, C&I distributed generation, and residential rooftop installations is driving diverse requirements for upstream materials and end products. Meanwhile, high temperatures and dust in some regions, along with salt-laden coastal environments, place greater demands on the electrical performance, mechanical reliability, and environmental adaptability of PV products. In response to these varied market needs, TCL Zhonghuan is presenting its X-series high-efficiency silicon wafers, alongside TCL Solar PV modules and BlueArk energy storage products, showcasing solutions spanning upstream PV materials through power generation and energy storage.
X-Series Wafers: Supporting High-Efficiency Cell Manufacturing
The X-series wafers are among the key highlights of the portfolio. Through optimizations in crystal growth and related manufacturing processes, the series is designed to control impurity levels and improve material properties, supporting downstream high-efficiency solar cell manufacturing.
Wafer electrical properties and mechanical reliability directly affect cell manufacturing performance and finished-product yields, making them important considerations in material selection. With India’s market increasingly focused on power generation efficiency and project economics, X-series wafers are compatible with mainstream high-efficiency cell technologies, including TOPCon, HJT and xBC, offering cell manufacturers additional options for process optimization and performance improvement.
TCL Solar PV Modules: Designed for Diverse Applications
At the exhibition, TCL Solar is showcasing its T5 Pro and C2 series PV modules. The T5 Pro features high-density encapsulation technology and a three-section cell design, delivering 17% higher power generation than conventional half-cut modules under shading conditions, with a temperature coefficient of -0.26%/°C. The C2 adopts back-contact (BC) technology and a zero-gap design, combining a larger effective power-generating area with low-light performance, shading tolerance, and low degradation. Designed for diverse operating conditions, both series offer solutions for utility-scale, C&I distributed generation, and residential applications. TCL Solar continues to advance BC and TOPCon technologies to meet the evolving needs of the Indian market.
BlueArk Energy Storage: Solutions for Residential, Microgrid and C&I Applications
The BlueArk energy storage series is also on display, covering residential and small commercial use, off-grid and microgrid systems, and C&I applications. The BlueArk X1 features an integrated design for homes and small businesses, while the X5 supports coordinated operation with PV systems and diesel generators for remote areas and industrial parks. The W10 adopts liquid cooling and AI-powered early-warning capabilities to meet C&I energy management needs. Together, the series offers flexible storage solutions to improve energy utilization, optimize electricity costs, and support more reliable power supply across diverse applications.
Strengthening Industry Collaboration and Exploring India’s Solar and Storage Opportunities
As the global energy transition advances, India’s PV industry is seeing new opportunities in both manufacturing capacity development and market expansion. Innovation in upstream materials and stronger value-chain collaboration will also play an important role in supporting the industry’s long-term development.
TCL Zhonghuan will continue to advance silicon wafer technology and product innovation while deepening technical exchanges and business collaboration with partners across the PV value chain, contributing to the global energy transition and a more sustainable, low-carbon future.
 View original content to download multimedia:https://www.prnewswire.co.uk/news-releases/tcl-zhonghuan-powers-indias-energy-transition-with-pv-innovations-at-rei-expo-2026-302918175.html

23, Oct 2026
Infosys:Differentiated AI strategy and a sharp focus on value unlock propels 29% sequential growth in AI revenues
- Robust Q2 large deal TCV at $5.2 billion with 62% net new; lays solid foundation for future growth
- FY 27 revenue guidance revised to 1%-2% and margin guidance retained at 20%-22%
BENGALURU, India, Oct. 23, 2026 /PRNewswire/ — Infosys (NSE: INFY) (BSE: INFY) (NYSE: INFY), a global leader in AI-first business consulting and technology services, delivered $5,145 million in Q2 revenues, year on year growth of 1.5% and sequential growth of 1.2% in constant currency. Operating margin was stable at 21.0%. EPS growth was 8.7% year on year in rupee terms. TCV of large deal wins was $5.2 billion, with 62% net new.

H1 revenues grew at 1.9% year on year in constant currency. Operating margin for H1 was at 21.0%.
“We had strong large deals of $5.2 billion, including a mega deal of over $2 billion, reinforcing our position as a trusted partner in the marketplace when clients embark on large and complex transformation programs. Our AI revenue was at 10.5% and grew 29% quarter-on-quarter. As enterprises move to AI adoption at scale, the strong growth in AI revenues is a recognition of our differentiated market positioning and client confidence,” said Salil Parekh, CEO and MD. “We are advising some of the largest global enterprise on their AI strategy and continue to invest in deep domain and technology capabilities to bring new ideas and an integrated ecosystem to help businesses unlock AI value at scale,” he added.
|
1.2% QoQ CC Growth |
21.0% Operating |
8.7% YoY EPS Increase |
$5.2 Bn Large Deal TCV (62% Net New) |
$0.93 Bn Free Cash Flow (FCF) |
10.5% AI as a % of |
Guidance for FY 27:
- Revenue growth of 1%-2% in constant currency
- Operating margin of 20%-22%
Key highlights:
|
For the quarter ended September 30, 2026 |
For the six months ended September 30, 2026 |
|
|
|
“We delivered operating margins of 21.0% in Q2 amidst heightened volatility. Focus on cost and operational efficiency measures while making the required investments, have led to stable margins,” said Jayesh Sanghrajka, CFO. “Free cash flow of $928 million, representing 113.3% of net profit, underscores the financial strength of the business. The Board has announced an interim dividend of ₹26 per share, an increase of 13% from last year,” he added.
Client Wins & Testimonials
- Infosys collaborated with Mondelez International to drive its supply chain transformation through AI-enabled decision-making, data standardization, and intelligent enterprise workflows. Sanjay Gurbaxani, Global Vice President, Digital Supply Chain, Mondelez International, said, “From digitally connected supply chain to standardizing data and enabling more informed decision-making, the opportunity lies in bringing together people, processes, data, and technology to deliver meaningful business outcomes. As AI evolves towards agentic AI, the potential extends beyond generating insights to enable more autonomous, responsive, and intelligent workflows. The real value comes from embedding intelligence into everyday business decisions, rethinking established processes, and scaling solutions across the enterprise. With Infosys we are building a compelling solution where technology, aligned with business priorities, can become a catalyst for operational excellence and long-term impact.”
- Infosys entered a ten-year strategic agreement with Crocs, Inc. to accelerate its IT transformation and support scalable global growth. Tom Britt, Chief Information Officer, Crocs, Inc. said, “As our organization reimagines its IT landscape, we sought a collaborator who could combine deep domain expertise with a commitment to innovation and operational excellence. By leveraging Infosys’ proven delivery frameworks and advanced automation capabilities, we will optimize operations, reduce costs and scale responsibly—while driving continuous improvement and building a foundation for sustainable growth and digital resilience that positions Crocs, Inc. for the future.”
- Infosys collaborated with Knorr-Bremse to accelerate its AI-enabled enterprise transformation. Satheeskaran Navaratnam, Chief Digital Officer & VP Transformation & Governance IT, Knorr-Bremse, said, “At Knorr-Bremse, we are building a future-ready technology foundation that supports innovation and long-term value creation. Our Tech4Value program is central to this journey, helping us create a more agile, efficient, and scalable IT environment across the organization. By working with Infosys, we aim to make our technology estate as optimized and reliable as the systems we build for our customers, ensuring that every layer of our infrastructure is equipped to support the pace of change our business demands.”
- Infosys expanded collaboration with Metsä Group to drive AI-led transformation of its IT landscape. Kristiina Lammila, Chief Information Officer of Metsä Group, said, “This engagement marks a new chapter in Metsä’s long-standing collaboration with Infosys, as we simplify and transform our IT sourcing model to meet the efficiency demands of today’s business environment. We are confident in our joint ability to deliver on these targets and accelerate the transformation of Metsä’s IT, powered by AI.”
- Infosys collaborated with NTN Corporation to drive its digital growth with seamless SAP cloud adoption. Kenji Kitazato, Head – ICT Strategy Department, NTN Corporation, said, “This migration to SAP Commerce Cloud powered by Infosys has streamlined our IT operations, improved agility, and laid a strong foundation for future digital growth. This transformation enables us to utilize this new foundation and further promote the use of digital technology.”
- Infosys collaborated with Telia to drive AI-powered transformation across its network and cybersecurity operations. Hein Müskens, Group CIO, Telia, said, “Infosys’ proven expertise in AI, automation, and telecom transformation made them the ideal partner for this initiative. Leveraging Infosys Topaz and deep industry knowledge, we look forward to accelerating the modernization of our network and cybersecurity operations, enhancing efficiency and agility, and strengthening our foundation for future innovation.”
- Infosys collaborated with KnitWell Group to develop an AI-powered platform for its customer engagement. Jaap van Riel, CTO, KnitWell Group, said, “Our relationship with our customers truly comes to life in our stores. That’s why we partnered with Infosys to build the Engage platform and help our store associates reach customers in a more efficient and engaging way. Once we identified the opportunity, Infosys was quick to develop a solution and approach. From there, we engineered and built Engage together, and we’ve seen great results.”
- Infosys Finacle was selected by Investec to drive its digital banking transformation through the Finacle SaaS platform on Microsoft Azure. Lyndon Subroyen, Global Head of Digital and Technology for Investec Group, said, “Our partnership with Infosys Finacle and Microsoft Azure marks a step change in our digital transformation journey. We are building a stronger digital foundation that allows us to scale with our clients, deliver a more seamless and personalized experience, and operate with greater precision. Digital is no longer a layer that supports the business, it is integral to how we grow, deepen client relationships, and improve our efficiency.”
Recognitions & Awards
Brand & Corporate
- Recognized as one of India’s Best Employers Among Nation-Builders by Great Place to Work® for the sixth year in a row.
- Recognized across four Avtar & Seramount indices, including Hall of Fame – Best Companies for Women India 2026; Exemplar in the Most Inclusive Companies Index India 2026; Top 10 Best Companies for Workplace Wellness (BCWW); and Top 10 Best Companies for ESG (BCESG).
- Received three Brandon Hall Group™ 2026 HCM Excellence Awards® for Best Corporate Learning University; Best Senior Manager Development Program; and Best Sourcing and Assessment Strategy.
- Received The Asset Corporate Sustainability Leadership Awards 2026 in four categories – Platinum Award; Best in Transition; Best Initiative in Environmental Responsibility for the Infosys Agroforestry Program; and Best Investor Relations Team.
- Infosys BPM honored with multiple Tata Institute of Social Sciences LeapVault CLO Awards India for Best Skill Development Initiative, Best Corporate University, and Best Diversity & Inclusion Training Program.
- Infosys BPM won the 17th CSR Summit & Awards 2026 for Best Skill Development Initiative.
AI and Cloud Services
- Rated as a Leader in the Gartner® Magic Quadrant™ for Public Cloud Optimization and Transformation Services.
- Recognized as a Leader in the IDC MarketScape: Worldwide Cloud Professional Services in the AI Era 2026 Vendor Assessment.
- Positioned as a Leader among the top providers in the Everest Group Microsoft Azure Services PEAK Matrix® Assessment 2026.
- Positioned as a Leader in the Everest Group Quality Engineering (QE) Services for AI Applications and Systems PEAK Matrix® Assessment 2026.
- Featured as a Leader in the NelsonHall NEAT Evaluation for AI-Enabled Cloud Infrastructure Management Services.
- Recognized as a Leader in the 2026 Constellation ShortList™ for AI Services.
- Recognized as a Leader on the 2026 Constellation ShortList™ for Public Cloud Transformation Services.
- Recognized as a Leader in the 2026 Constellation ShortList™ for Artificial Intelligence and Machine Learning Best-of-Breed Platforms.
- Recognized as a Leader in the 2026 Constellation ShortList™ for Decision Intelligence Platforms.
Key Digital Services
- Rated as a Leader in The Forrester Wave™: Infrastructure Outsourcing Services, Q3 2026.
- Recognized as a Leader in the IDC MarketScape: Worldwide ServiceNow Implementation Services 2026 Vendor Assessment.
- Recognized as a Leader in the IDC MarketScape: Worldwide Oracle Implementation Services 2026 Vendor Assessment.
- Recognized as a Leader in the IDC MarketScape: Worldwide Digital Workplace Services 2026 Vendor Assessment.
- Positioned as a Leader in the Everest Group Digital Workplace Services (DWS) PEAK Matrix® Assessment 2026: North America.
- Positioned as a Leader in the Everest Group Digital Workplace Services (DWS) PEAK Matrix® Assessment 2026: Europe.
- Positioned as a Leader in the Everest Group Retail Digital Services PEAK Matrix® Assessment 2026.
- Positioned as a Leader in the Everest Group GCC Setup Capabilities in India PEAK Matrix® Assessment 2026.
- Recognized as a Leader in the 2026 Constellation ShortList™ for AI-Native Global Capability Center (GCC) Services.
- Rated as a Leader in HFS Horizons: Customer Experience Services, 2026.
- Featured as a Leader in the NelsonHall NEAT Evaluation for Salesforce Services 2026.
- Featured as a Leader in the NelsonHall NEAT Evaluation for SAP Ecosystem Services.
- Infosys BPM received the Avasant Digital Masters: Technology and Process Transformation Leaders Award at Avasant Partner Connect 2026.
- Infosys BPM received three GSA UK Awards 2026 for Service Provider of the Year (Large); Business Services Programme of the Year with Microsoft; and Collaboration Programme of the Year with Lloyd’s Register.
Industry & Solutions
- Recognized as a Leader in the IDC MarketScape: Worldwide AI-Driven Professional Services for Oil and Gas Companies 2026 Vendor Assessment.
- Recognized as a Leader in the IDC MarketScape: Worldwide AI-Driven Digital Strategy and Consulting Services for Oil and Gas Companies 2026 Vendor Assessment.
- Positioned as a Leader in the Everest Group Pharmaceutical R&D IT Services PEAK Matrix® Assessment 2026.
- Positioned as a Leader in the Everest Group Life and Annuity (L&A) Insurance IT Services PEAK Matrix® Assessment 2026.
- Infosys Finacle recognized as a Leader in the IDC MarketScape: Worldwide Trade Finance Systems 2026 Vendor Assessment.
- Infosys Finacle rated as a Leader in the 2026 Gartner® Magic Quadrant™ for Retail Core Banking Systems in Europe.
- Infosys Finacle received Global BankTech Awards 2026 by the Digital Banker 2026 in three categories: Outstanding Trade Finance Solution by a Vendor; Best Liquidity Management Solutions Provider by a Vendor; and Best Treasury Management Solutions Provider by a Vendor.
Read more about our Awards & Recognitions here.
About Infosys
Infosys (NSE, BSE, NYSE: INFY) is a global leader in AI first business consulting and technology services. Over 325,000 of our people work to amplify human potential and create the next opportunity for people, businesses, and communities. As navigators of enterprise transformation, we enable businesses in 59 countries to unlock AI value at scale. With over four decades of experience in managing the systems and workings of global enterprises, we accelerate business transformation through our AI-first value framework, deep domain expertise, and our unique ability to orchestrate innovations from our AI-native partner ecosystem. Infosys is recognized as the fastest growing IT services brand globally, committed to being a well-governed, environmentally sustainable partner for our clients where deep talent expertise, in an inclusive workplace, help them navigate their next.
Safe Harbor
Certain statements in this release, including those concerning our future events, future growth prospects, our future financial or operating performance and our offerings and collaborations, are “forward looking statements” intended to qualify for the ‘safe harbor’ under the Private Securities Litigation Reform Act of 1995. Such forward-looking statements are based on our current expectations, assumptions, estimates and projections about the Company, our industry, economic conditions in the markets in which we operate, and certain other matters. These forward-looking statements are subject to substantial known and unknown risks, uncertainties and other factors, that could cause actual results or outcomes to differ materially from those implied by such forward-looking statements. Important factors that may cause actual results or outcomes to differ from those implied by the forward-looking statements include, but are not limited to, risks and uncertainties regarding the execution of our business strategy, increased competition for talent, our ability to attract and retain personnel, increase in wages, investments to reskill our employees, our ability to effectively implement a hybrid work model, economic uncertainties and geo-political situations, technological disruptions and innovations such as artificial intelligence, the complex and evolving regulatory landscape including immigration regulation changes, particularly in the United States, our Environmental, Social, Governance (“ESG”) vision, our capital allocation policy and expectations concerning our market position, future operations, margins, profitability, liquidity and capital resources, our corporate actions including acquisitions, cybersecurity matters, the outcome of pending litigation and the US government investigation, and the effect of current and future tariffs. These and additional factors that may cause actual results or outcomes to differ from those implied by the forward-looking statements are discussed in more detail in our US Securities and Exchange Commission filings including our Annual Report on Form 20-F for the fiscal year ended March 31, 2026. These filings are available at www.sec.gov. In light of these and other uncertainties, you should not conclude that the results or outcomes referred to in any of the forward-looking statements will be achieved. Infosys may, from time to time, make additional written and oral forward-looking statements, including statements contained in the Company’s filings with the Securities and Exchange Commission and our reports to shareholders. The Company does not undertake to update any forward-looking statements that may be made from time to time by or on behalf of the Company unless it is required by law.
|
Infosys Limited and Subsidiaries |
||
|
Extracted from the Condensed Consolidated Balance Sheet under IFRS as at: |
(In $ million) |
|
|
Particulars |
September 30, 2026 |
March 31, 2026 |
|
ASSETS |
||
|
Current assets |
||
|
Cash and cash equivalents |
2,541 |
2,341 |
|
Current investments |
1,436 |
1,365 |
|
Trade receivables |
3,634 |
3,715 |
|
Unbilled revenue |
1,733 |
1,633 |
|
Other current assets |
1,691 |
1,858 |
|
Total current assets |
11,035 |
10,912 |
|
Non-current assets |
||
|
Property, plant and equipment and Right-of-use assets |
2,069 |
2,057 |
|
Goodwill and other Intangible assets |
2,013 |
1,576 |
|
Non-current investments |
875 |
942 |
|
Unbilled revenue |
224 |
183 |
|
Other non-current assets |
844 |
776 |
|
Total non-current assets |
6,025 |
5,534 |
|
Total assets |
17,060 |
16,446 |
|
LIABILITIES AND EQUITY |
||
|
Current liabilities |
||
|
Trade payables |
469 |
500 |
|
Unearned revenue |
1,234 |
1,248 |
|
Employee benefit obligations |
370 |
372 |
|
Other current liabilities and provisions |
3,517 |
3,396 |
|
Total current liabilities |
5,590 |
5,516 |
|
Non-current liabilities |
||
|
Lease liabilities |
516 |
634 |
|
Other non-current liabilities |
565 |
456 |
|
Total non-current liabilities |
1,081 |
1,090 |
|
Total liabilities |
6,671 |
6,606 |
|
Total equity attributable to equity holders of the company |
10,333 |
9,786 |
|
Non-controlling interests |
56 |
54 |
|
Total equity |
10,389 |
9,840 |
|
Total liabilities and equity |
17,060 |
16,446 |
|
Extracted from the Condensed Consolidated Statement of Comprehensive Income under IFRS for: |
||||
|
(In $ million except per equity share data) |
||||
|
Particulars |
3 months ended |
3 months ended |
6 months ended |
6 months ended |
|
Revenues |
5,145 |
5,076 |
10,227 |
10,018 |
|
Cost of sales |
3,547 |
3,516 |
7,028 |
6,933 |
|
Gross profit |
1,598 |
1,560 |
3,199 |
3,085 |
|
Operating expenses: |
||||
|
Selling and marketing expenses |
260 |
254 |
531 |
512 |
|
Administrative expenses |
259 |
241 |
517 |
480 |
|
Total operating expenses |
519 |
495 |
1,048 |
992 |
|
Operating profit |
1,079 |
1,065 |
2,151 |
2,093 |
|
Other income, net of finance cost |
77 |
100 |
168 |
210 |
|
Profit before income taxes |
1,156 |
1,165 |
2,319 |
2,303 |
|
Income tax expense |
337 |
325 |
680 |
654 |
|
Net profit (before non-controlling interests) |
819 |
840 |
1,639 |
1,649 |
|
Net profit (after non-controlling interests) |
817 |
839 |
1,637 |
1,647 |
|
Basic EPS ($) |
0.20 |
0.20 |
0.40 |
0.40 |
|
Diluted EPS ($) |
0.20 |
0.20 |
0.40 |
0.40 |
NOTES:
a) The above information is extracted from the audited condensed consolidated Balance sheet and Statement of Comprehensive Income for the quarter and six months ended September 30, 2026, which have been taken on record at the Board meeting held on October 23, 2026.
b) Revenue growth in reported currency includes the impact of currency fluctuations. Additionally, we calculate constant currency (CC) growth by comparing current period revenues in respective local currencies converted to US$ using prior period exchange rates and comparing the same to our prior period reported revenues.
c) A Fact Sheet providing the operating metrics of the Company can be downloaded from www.infosys.com.
d) As the quarter and six months ended figures are taken from the source and rounded to the nearest digits, the quarter figures in this statement added up to the figures reported for the previous quarter might not always add up to the six months ended figures reported in this statement.
IFRS-INR Press Release: https://www.infosys.com/investors/reports-filings/quarterly-results/2026-2027/q2/documents/ifrs-inr-press-release.pdf
Fact sheet: https://www.infosys.com/investors/reports-filings/quarterly-results/2026-2027/q2/documents/fact-sheet.pdf
 View original content to download multimedia:https://www.prnewswire.co.uk/news-releases/infosys-differentiated-ai-strategy-and-a-sharp-focus-on-value-unlock-propels-29-sequential-growth-in-ai-revenues-302918095.html

23, Oct 2026
India’s Spiritual Leadership Takes Center Stage Globally: *H.H. Shree Shivkrupanand Swami, promoter of global spritual platform ‘Gurutattva’ and ‘Himalayan Samarpan Meditation’, appointed Vice Chair of ‘World Meditation Day Governance Committee’
NEW DELHI, Oct. 23, 2026 /PRNewswire/ — In a historic milestone marking India’s deepening spiritual footprint and civilizational diplomacy on the world stage, revered Indian spiritual master and founder of Himalayan Samarpan Meditation, His Holiness Shree Shivkrupanand Swamiji, has been appointed as the Vice Chair of the World Meditation Day Governance Committee and Chairperson for the Southern Asia Region.

The World Meditation Day Association and the World Meditation Foundation formally announced the appointment through a joint accord. Swamiji represents India as a core proposing nation on the high-level international bureau alongside global figures, including Acting Chair Enrico Somma representing Liechtenstein.
The high-level appointment aligns with the international observance of World Meditation Day (December 21), an initiative spearheaded through global non-governmental momentum and supported at the multilateral level to integrate mindfulness, inner equilibrium, and collective consciousness into human daily life. The official global platform and governance portal are slated for formal unveiling during the upcoming 2nd International Symposium on AI + Meditation, marking an unprecedented convergence between traditional Himalayan wisdom and emerging frontier technologies.
Reasserting India’s Spiritual Eminence
India has long served as the crucible of yoga, dhyana, and inner engineering. Following the worldwide adoption of International Yoga Day, this appointment reinforces India’s recognized role as the global compass for holistic well-being and peaceful coexistence (Vasudhaiva Kutumbakam).
Swamiji’s elevation to the helm of this global governing body underlines that authentic Himalayan meditation practices are increasingly sought after by world institutions grappling with modern fragmentation, stress epidemics, geopolitical friction, and cognitive burnout.
“World peace can never come through any book or weapon; world peace can begin only with inner peace,” stated H.H. Shree Shivkrupanand Swami. “True meditation is an inward journey to self-realisation where one’s own soul becomes one’s guide. By transforming the individual from within, we foster universal brotherhood and an enduring architecture for global harmony.”
Swamiji founded Himalayan Samarpan Meditation in 1994, dedicating the past three decades to teaching meditation completely free of charge to over 3 million seekers spanning more than 72 nations. With dedicated meditation sanctums (Dhyanasthalis) established across India, North America, Europe, Africa, and Southeast Asia, Swamiji’s new mandate will catalyze structured, cross-border wellness frameworks across the South Asian subcontinent and beyond.
About Gurutattva:
Gurutattva initiative is a global spiritual movement founded by His Holiness Shree Shivkrupanand Swamiji in 1994. Dedicated to personal well-being and universal harmony, Gurutattva brings the 800-year-old wisdom of Himalayan Samarpan Meditation to practitioners around the globe. Swamiji founded Himalayan Samarpan Meditation in 1994 and has dedicated the past three decades to teaching meditation free of charge to over 3 million seekers in more than 72 nations. Operating under the principle of Vasudhaiva Kutumbakam (The World as One Family), the organization blends spiritual practice (Sadhna) with selfless service (Seva) to help individuals achieve inner peace and holistic growth. Learn more at www.gurutattva.org
For more information, reach out to support@gurutattva.org
 View original content to download multimedia:https://www.prnewswire.co.uk/news-releases/indias-spiritual-leadership-takes-center-stage-globally-hh-shree-shivkrupanand-swami-promoter-of-global-spritual-platform-gurutattva-and-himalayan-samarpan-meditation-appointed-vice-chair-of-world-meditation-day-govern-302918032.html

23, Oct 2026
New Prize Pool Unlocked: Bybit Extends USD1 Hold & Earn Program With 27 Million WLFI in Rewards
DUBAI, UAE, Oct. 23, 2026 /PRNewswire/ — Bybit, the New Financial Platform trusted by more than 80 million users worldwide, has extended its USD1 Hold & Earn program following strong community demand. The bonus month offers a 27,000,000 WLFI reward pool with up to competitive APR for eligible USD1 holders.
The extension follows five consecutive months of sustained participation since the program’s debut in May 2026 as part of Bybit’s USD1 Ecosystem Carnival. The bonus round started from October 17, 2026 and will conclude on November 15, 2026, as Bybit and its ecosystem partners respond to popular demand and continue to craft rewarding experiences for the community.
As with previous months, eligible Bybit users who hold a minimum of 1 USD1 in their account will automatically earn daily WLFI rewards. No staking, subscription or lock-up is required.
The USD1 Holder Leaderboard is updating daily to rank the top 50 USD1 holders on Bybit by effective holdings.
USD1 balances are snapshotted hourly each day, with WLFI rewards credited to the Main Account Funding Wallet around 06:00 UTC the following day. Daily rewards are derived from effective USD1 holdings, settlement prices sourced from the Bybit Spot Market, and the prevailing daily APR. Actual APR and reward amounts may vary based on total participation and market pricing during the campaign period.
USD1 is a USD-backed stablecoin issued by World Liberty Financial, fully collateralized by short-term U.S. Treasury securities and cash equivalents and designed to maintain a stable 1:1 peg with the US Dollar. WLFI is the governance token of World Liberty Financial, a DeFi protocol built to broaden access to decentralized financial services. Token holders can participate in protocol governance decisions and contribute to the direction of the ecosystem.
Terms and conditions apply. For details on eligibility and potential restrictions, users may visit: USD1 Hold & Earn Month 6: 27M WLFI Rewards, Up to 10% APR
#Bybit / #NewFinancialPlatform
About Bybit
Bybit is The New Financial Platform.
We believe every person should have access to every financial opportunity on earth. That’s why we’re building the first intelligent platform that connects anyone, anywhere to the world’s finance.
Trusted by more than 80 million users worldwide, Bybit brings together investing, trading, payments, and wealth-building in a single secure and intelligent ecosystem. Through the combination of AI-powered technology, deep global liquidity, robust security, and transparent operations, Bybit makes global finance more accessible, efficient, and empowering for everyone.
Built for everyone. Powered by intelligence. Open to the world.
Learn more at Bybit.com.
For more details about Bybit, please visit Bybit Press
For media inquiries, please contact: media@bybit.com
For updates, please follow: Bybit’s Communities and Social Media
Facebook | Instagram | LinkedIn | Reddit | Telegram | TikTok | X | Youtube
 View original content to download multimedia:https://www.prnewswire.co.uk/news-releases/new-prize-pool-unlocked-bybit-extends-usd1-hold–earn-program-with-27-million-wlfi-in-rewards-302918045.html

23, Oct 2026
Chandigarh University Hosts Five-Day Law Fest ‘Lex Nova 2026,’ Bringing Legal Luminaries & Law Students Together to Explore the Power of Arbitration, Mediation & Conciliation
Arbitration, Mediation & Conciliation Can Reduce Pendency of Court Cases in India, says Justice Kuldeep Singh, Former Judge, Punjab & Haryana High Court
CHANDIGARH, India, Oct. 23, 2026 /PRNewswire/ — Giving law students an opportunity to gain practical knowledge of the world of justice, law and legal practice, Chandigarh University is hosting six-day ‘LEX NOVA 2026 – The Law Fest’, bringing together jurists, leading legal practitioners, legal minds and law students to explore the intricacies of ‘arbitration, mediation, and conciliation’ through Intra Moot Court Competition, Vidhi Samvad (mediation competition), Media Trial, Maxims Bee Quiz Competition, Legal Awareness Camp, Walkathon and a Nukkad Natak for taking legal awareness beyond the classroom.
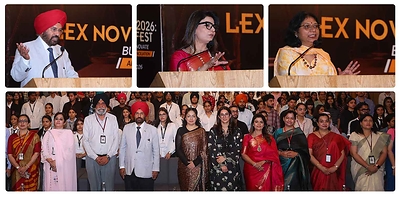
The dignitaries who graced the inauguration of the ‘LEX NOVA 2026 – The Law Fest’, organized by the University Institute of Legal Studies (UILS) at Chandigarh University with the theme ‘arbitration, mediation, and conciliation’, included Chief Guest, Justice Kuldeep Singh, former Judge, Punjab and Haryana High Court, Harleen Sharma, Additional and Sessions Judge and Director (Administration), Chandigarh Judicial Academy, Adv Gitanjali Kapoor, Senior Mediator, Supreme Court, Prof (Dr) Devinder Singh, Pro Vice Chancellor, Chandigarh University, Jannat Sandhu, Director, Chandigarh University, Prof (Dr) Simranjit Kaur Gill, Executive Director, UILS and Prof (Dr) Vandana Arora, Chairperson, Department of Laws, Panjab University, Chandigarh.
In his keynote address, the Chief Guest, Justice Kuldeep Singh, former Judge, Punjab and Haryana High Court said, “Today arbitration, mediation and conciliation has become very important because of the delay in dispensation of justice. If a case goes up to the Supreme Court that means whole of your life and maybe your next generation will hear the judgement, so such a judgment is of no use to you. As the awareness is increasing about our rights, the spirit to contest everything in court is also going up. So, that is causing the delay. Justice needs to be done not just correctly but speedily also. For this, arbitration, conciliation and mediation can play an important role because it provides a common platform to settle cases with some give and take between the two parties. This leads to happy ending.”
“But if the arbitration doesn’t succeed, the matter can be referred to the arbitrator. Under the Arbitration Act the matter has to be decided within one year. So normally such a case is decided within six months or 12 months So that is much less than the time taken by the courts. While not every dispute can be resolved this way, most can be settled through mediation and conciliation—either before litigation begins or while it is ongoing. The ‘give-and-take’ method is highly effective these days. It helps preserve good relationships, sparing you from unnecessary stress and worry. Whether it concerns property or a matrimonial dispute, it allows you to move forward and live in peace. That is the benefit of institutions like arbitration, mediation and conciliation. If both parties agree to arbitration, matters can be resolved quite swiftly,” he added.
Advising students to work hard, Justice Singh further said, “Success is always within reach—provided you work hard, remain innovative, and never lose heart. God always has something better in store for you. If you fail at something, it simply means that God has something better planned. Hard work is the key to success. Success doesn’t come overnight.”
In her address, Harleen Sharma, Additional and Sessions Judge and Director (Administration), Chandigarh Judicial Academy said, “The true strength of the justice system lies not merely in established laws or judicial verdicts, but in the rights it protects—thereby instilling public trust. While court judgments are essential, one must also recognize the significance of alternative dispute resolution (ADR) mechanisms. Processes such as mediation, conciliation, and arbitration render justice more accessible and effective.”
Advising students that the legal profession demands not only intellect but also strong character, she said “Strive to become not just successful lawyers, but true guardians of the Constitution, protectors of human dignity, and champions of justice.”
Speaking on the occasion, Adv Gitanjali Kapoor, Senior Mediator, Supreme Court said, “Earlier is arbitration, mediation and conciliation was not a career or a glamorous corner of the law. But today it is the center of law. Though our lawyers are judges as they are working tirelessly and extraordinarily putting in all their efforts to lower down the pendency of cases, still the pendency in the courts these days is running into crores across the country. And for this is the reason why ADR (Alternative Dispute Resolution) is important. While the courts are doing their job and the mediators and arbitrators are doing their job so that the court room can do what they are actually meant to be doing. There are cases which can be settled outside the court room without intervention of the judges.”
In his address, Prof (Dr) Devinder Singh, Pro Vice Chancellor, Chandigarh University said, “Prof (Dr) Devinder Singh, Pro-Vice-Chancellor of Chandigarh University, stated, “India’s justice system faces several challenges, including a large backlog of about 6 crore pending cases, delays in the delivery of justice, high legal costs, and an insufficient number of judges. Law students should understand these challenges and contribute toward making the country’s justice system more effective.”
Earlier in her welcome address, Jannat Sandhu, Director, Chandigarh University said, “Lex Nova 2026 highlights the growing importance of collaborative dispute resolution and the need to make justice more accessible and effective. At Chandigarh University, we believe that legal education extends beyond classrooms, it is about nurturing critical thinkers, ethical professionals, and responsible citizens who understand that the true purpose of law is to uphold justice and serve the society.”
While the Intra Moot Court Competition during the Law Fest will provide law students a practical platform to cultivate their legal research, analytical reasoning, drafting, and courtroom advocacy skills, Vidhi Samvad (mediation competition) will enable law students to understand mediation. The Media Trial, the Breaking News Courtroom Challenge Programme will explore the complex relationship between law, media, justice and public opinion, Maxims Bee Quiz Competition will help law students understand important legal maxims and their practical application, the Legal Awareness Camp will promote legal literacy, the Walkathon aims to spread legal awareness, inclusion and public participation and the Nukkad Natak will bring conversations about rights, responsibilities and access to justice into a shared community space.
About Chandigarh University
Chandigarh University is a NAAC A+ Grade University and QS World Ranked University. This autonomous educational institution is approved by UGC and is located near Chandigarh in the state of Punjab. It is the youngest university in India and the only private university in Punjab to be honoured with A+ Grade by NAAC (National Assessment and Accreditation Council). CU offers more than 109 UG and PG programs in the field of engineering, management, pharmacy, law, architecture, journalism, animation, hotel management, commerce, and others. It has been awarded as The University with Best Placements by WCRC.
Website address: https://www.cuchd.in/
 View original content to download multimedia:https://www.prnewswire.com/in/news-releases/chandigarh-university-hosts-five-day-law-fest-lex-nova-2026-bringing-legal-luminaries–law-students-together-to-explore-the-power-of-arbitration-mediation–conciliation-302918047.html

23, Oct 2026
From the vibrant Aahara Mela to on-ground experiences, Coca-Cola’s beverage portfolio adds to the spirit of Mysuru Dasara
MYSURU, India, Oct. 23, 2026 /PRNewswire/ — As Mysuru’s Dasara 2026 celebrations draw to a close, Coca-Cola India together with its bottling partner Hindustan Coca-Cola Beverages (HCCB), enhanced the festive experience through a series of on-ground activations, consumer engagements, and expanded retail touchpoints across the city. With a presence at Aahara Mela, Mysuru’s biggest food festival, the company made its beverages accessible at key gathering points, complementing the city’s food culture and festive traditions.

At Aahara Mela, over 150 food stalls offered visitors a diverse range of culinary choices, with Sprite and Coca-Cola featured prominently across the festival. The beverages complemented the food offerings, giving visitors an opportunity to pair their favourite drinks with the flavours on offer.
Adding a distinct food-led engagement to the festivities, Sprite X Spicy made its first on-ground appearance at Mysuru Dasara. Bringing together the heat of spicy food and the refreshing taste of Sprite, the activation invited visitors to explore the classic pairing of spice and refreshment during the festival.
Beyond Aahara Mela, Coca-Cola India extended its presence through branded horse carts, highway activations with Sprite and Rimzim for wall paintings and chilling centres across key locations and travel routes, including Chamundi Hills, Brindavan Gardens, the Mysuru Dasara Flower Show at Kuppanna Park, and Srirangapatna. Sampling of Rimzim Zeera and Minute Maid tetra packs, alongside promotions for Sprite Lemon Mint, was also carried out to keep the visitors refreshed.
Desmond Nikhil Dsouza, Vice President – Integrated Operations (HCCB) & Commercial, Coca–Cola India & Southwest Asia, said, “Festivals bring communities together through shared traditions, local experiences and moments of celebration. Our beverage portfolio and on-ground experiences add to the many ways people enjoy these occasions. Through our diverse beverage portfolio, on-ground presence and extensive bottling and distribution network, we seek to be part of these special occasions, while also recognizing the contribution of our local retailers and distribution channels who are integral to the festive ecosystem.”
Vinay Nair, Chief Commercial Officer, Hindustan Coca–Cola Beverages (HCCB), said, “Delivering a consistent consumer experience during a large-scale celebration such as Mysuru Dasara requires strong execution across our distribution network and close engagement with distributors and retail partners. Our focus is on ensuring product availability across relevant consumer touchpoints, backed by strong operational readiness and effective market execution to meet demand during the festive period.”
Through its presence at Mysuru Dasara, Coca-Cola India extended its beverage portfolio across the city’s festive and culinary landscape, while working alongside local retail partners to serve consumers and support the ecosystem that makes the celebrations possible.
About Coca-Cola
Coca-Cola in India is one of the country’s leading beverage companies, offering a range of high-quality and refreshing beverage options to consumers. The company, in line with its vision of ‘Beverages For Life’ offers a wide portfolio of products which includes hydration, sports, sparkling, coffee, tea, nutrition, juice and dairy based products. In India its beverage range includes Coca-Cola, Coca-Cola Zero Sugar, Diet Coke, Thums Up, Thums Up XForce, Charged, Fanta, Limca, Sprite, Sprite Zero, Kinley Soda, Rimzim, Maaza, Minute Maid range of juices and Honest Tea. The Company also offers hydration beverages including Limca GlucoCharge, Smartwater, Kinley, Kinley Copper, Dasani and Bonaqua packaged drinking water. Premium products constitute Schweppes’ range and Smartwater. In addition, it offers a Costa Coffee range of tea and coffee. The Company is constantly transforming its portfolio, from reducing sugar in its drinks to bringing innovative new products to market.
The Company along with its owned bottling operations and franchise bottling partners has a strong network of over six million retail outlets through which it refreshes millions of consumers across the country. It seeks to positively impact people’s lives, communities, and the planet through water and packaging initiatives, sustainable agriculture and emission reductions across its value chain.
Globally together with its bottling partners, The Coca-Cola Company employs more than 700,000 people, helping to bring economic opportunity to local communities worldwide. Learn more at www.cocacolacompany.com and follow us on Twitter, Instagram, Facebook and LinkedIn.

 View original content to download multimedia:https://www.prnewswire.com/in/news-releases/from-the-vibrant-aahara-mela-to-on-ground-experiences-coca-colas-beverage-portfolio-adds-to-the-spirit-of-mysuru-dasara-302918064.html