


27, Oct 2026
Modal Raises $750 Million in Series D Round: NYSE Content Update
NYSE issues a pre-market daily advisory direct from the trading floor.
NEW YORK, Oct. 27, 2026 /PRNewswire/ — The New York Stock Exchange (NYSE) provides a daily pre-market update directly from the NYSE Trading Floor. Access today’s NYSE Pre-market update for market insights before trading begins.
Kristen Scholer delivers the pre-market update on October 27th
- Modal boosts valuation to $15.75 billion
- The company also announced that it crossed $1 billion in annualized run rate.
- Modal builds AI building blocks allowing developers to create a wide range of applications.
- CEO Erik Bernhardsson will join NYSE Live to discuss what’s fueling the company’s rapid growth.
- ClioCon 2026 gets underway from Boston
- Annual event is hosted by legal practice software firm Clio.
- It’s bringing together lawyers, industry leaders, and technology businesses.
- Clio CEO Jack Newton will join Taking Stock to deliver his biggest takeaways from the event.
- Earnings season underway while Fed kicks off two-day policy meeting
- UPS and Coca-Cola delivered their latest quarterly figures this morning.
- NYSX components Microsoft, Alphabet, and Amazon will report this week.
- The FOMC meeting kicks off today, with policymakers due to announce their decision on interest rates Wednesday afternoon.
Opening Bell
Kimco Realty (NYSE: KIM) celebrates its 35th anniversary of listing
Closing Bell
Ducommun (NYSE: DCO) celebrates its 30th anniversary of listing
For market insights, IPO activity, and today’s opening bell, download the NYSE TV App and check out the NYSE YouTube: TV.NYSE.com and YouTube.com/@NYSEofficial


 View original content to download multimedia:https://www.prnewswire.co.uk/news-releases/modal-raises-750-million-in-series-d-round-nyse-content-update-302920751.html

- 0
- By PRNewswire

27, Oct 2026
Guidewire Delivers the Open, Secure, and Complete Core Platform for Agentic Insurance
Insurers gain speed and precision across the insurance lifecycle to launch products faster, assess and price risk more effectively, and resolve claims sooner
LAS VEGAS, Oct. 27, 2026 /PRNewswire/ — CONNECTIONS CONFERENCE — Guidewire (NYSE: GWRE) today launched a new platform approach to agentic insurance, giving insurers an open, secure, and complete foundation for putting AI to work across the insurance lifecycle. By bringing together the applications, data, workflows, and controls insurers need, Guidewire sets out a practical model for moving from isolated AI experiments to governed agents that improve the speed and precision of insurance decisions and actions.

“Insurance is a business of decisions and actions made in context,” said Mike Rosenbaum, chief executive officer, Guidewire. “By embedding agentic capabilities where insurers already run their core operations, Guidewire gives agents the context and controls they need to work with speed and precision on a proven durable foundation.”
Guidewire agents run on the same trusted platform as its core applications and work with an insurer’s current data and workflows. For agents to work effectively, they need to know what is true, what has already been done, and what they are allowed to do. The platform’s controls enforce those boundaries with consistent security and a clear audit trail that remains current and secure through ongoing updates.
“We took a platform approach to AI, so agents run on the same platform as the core, with access to an insurer’s context, data, and workflows,” said Diego Devalle, chief product development officer, Guidewire. “The scalability and observability that already support the core now support agents too. That is why insurers can put them to work on live claims and policies, and why developers can build on the same open foundation.”
The examples below represent a sample of Guidewire’s growing portfolio of agents and agentic capabilities across the insurance lifecycle. Guidewire will continue to expand this portfolio, giving insurers more ways to put agents to work within the workflows and controls of the Guidewire platform.
Agentic underwriting
The speed of competition in the market is putting pressure on insurers to increase product and pricing agility. Guidewire shortens the path from product concept to market, giving underwriters clearer risk context and decision support within the work they already do.
- Advanced Product Designer. Product managers can now move products from intent to market-ready in days, with impact analysis, gap detection, and explainable recommendations. Agentic tooling speeds up the work of designing and refining products*.
- PricingCenter. Actuaries can move sophisticated pricing models to live rates in days by validating rules, factors, and adjustments while maintaining the established efficiency of promotion to production. This keeps portfolio impact visible. Native integration with PolicyCenter connects pricing decisions directly to policy workflows.*
- Risk Accumulation App*. Underwriters and portfolio managers can see concentration and exposure by peril on a map, from a single submission to the whole book. They can check how one risk changes portfolio exposure without leaving their normal workflow.
- UnderwritingCenter*. Underwriters gain greater productivity and precision and can quote directly in UnderwritingCenter. It turns raw submissions into clear risk profiles and matches risks to portfolio strategy and appetite. Direct integration moves the quote into PolicyCenter, removing the risk of handoffs.
- ProNavigator. Underwriters use embedded AI and Guidewire-developed agents* for submission summaries, relevant risk insights, and next-best actions.
Agentic claims
Claims teams face similar pressure to act quickly while increasing the precision of each decision. Guidewire puts agentic capabilities in the flow of work, from first notice of loss through adjudication and the broader indemnity supply chain.
- Concierge. Claimants connect with autonomous agents by voice or chat. The agents capture full loss details and deliver decision-ready claims to ClaimCenter.
- ProNavigator. Adjusters move from context to decision faster with answers, suggestions, and next-best actions from an embedded AI assistant and Guidewire-developed agents.
- Workers’ Compensation Solution. Claims teams can help injured workers recover sooner with a connected solution that links claims work with digital tools and AI.
“A claim goes faster when adjusters have the facts from the start,” said Amy Mollin, vice president, product management, Guidewire. “We built agents into ClaimCenter, where the work already happens, to capture the loss, summarize the file, and flag risk. That gives adjusters time back for the decisions and conversations that matter most to claimants and injured parties.”
“Insurers are moving beyond AI experimentation and looking for ways to put agentic AI to work across the insurance lifecycle,” said Karlyn Carnahan, executive partner, Celent. “The next challenge is making these capabilities work within the systems and workflows that run the business. That is where the platform matters. By connecting agents to core data and processes, Guidewire gives insurers a practical path to deploy them in production with the controls they need.”
Agentic platform and data
Guidewire gives technical teams the infrastructure and current insurance data to put agents into production and govern how they operate.
- Agentic Framework. Insurers can use Guidewire-developed agents or build their own, select the model for each task, enforce guardrails, evaluate behavior, and monitor costs.
- Developer Assistants. Guidewire-aware assistants help technical teams update code, workflows, and rules faster.
- DevSpace*. Developers start sooner in preconfigured cloud environments with built-in Guidewire tooling.
- Guidewire Data Platform. Policy, claims, and billing data come together in one place, so agents and predictive models draw on the same data.
- Data Studio and Explore. Curated P&C datasets are ready to use on day one. Insurers can also draw business insight from their own data.
- Kaleidoscope*. Predictive models tuned to an insurer’s own book can also draw on industry and third-party data to fill gaps. Federated learning trains the models where each party’s data resides, so records don’t move and privacy is preserved.*
“Innovation is about reimagining how work gets done and giving our people the capabilities to make that possible,” said Tatjana Lalkovic, Chief Technology Officer, Definity. “Guidewire Developer Assistants bring relevant context directly into the development process, helping our teams move from idea to implementation faster while keeping human judgment and our standards at the center. It’s a great example of how we’re using AI to increase the pace of innovation and deliver value to our business, brokers, and customers sooner.”
Guidewire is also using AI to transform how it delivers programs with customers. Across professional services, Guidewire has embedded AI into its implementation methodology, materially reducing migration and implementation timelines. This enables insurers to put new capabilities in the hands of claims and underwriting teams sooner.
Guidewire is demonstrating these advancements this week at Guidewire Connections in Las Vegas, where over 3,000 insurers and partners from 36 countries have gathered for the company’s annual customer conference.
Certain release features may not be available in all regions.
*Indicates product feature is available for Early Access customers only or Guidewire Roadmap Features.
Connections keynote sessions will be livestreamed and available on-demand. To view the livestream and learn more about Guidewire’s new platform approach to agentic insurance, visit the Guidewire website.
About Guidewire
Guidewire is the platform P&C insurers trust to engage, innovate, and grow efficiently. More than 570 insurers in 44 countries, from new ventures to the largest and most complex in the world, rely on Guidewire products. With core systems leveraging data and analytics, digital, and artificial intelligence, Guidewire defines cloud platform excellence for P&C insurers.
We are proud of our unparalleled implementation record, with 1,700+ successful projects supported by the industry’s largest R&D team and consulting partner ecosystem. Our marketplace represents the largest partner community in P&C, where customers can access hundreds of applications to accelerate integration, localization, and innovation.
For more information, please visit www.guidewire.com and follow us on X and LinkedIn.
Media Contact:
Melissa Cobb
Director, Public Relations
Guidewire Software, Inc.
+1.650.464.1177
mcobb@guidewire.com
NOTE: For information about Guidewire trademarks, visit www.guidewire.com/legal-notices.
Cautionary Language Concerning Forward-Looking Statements
This press release contains forward-looking statements within the meaning of the safe harbor provisions of the Private Securities Litigation Reform Act of 1995, including but not limited to, statements regarding the general availability of features, programs, services, and tools mentioned in this press release (including, without limitation, Advanced Product Designer, PricingCenter, Risk Accumulation App, UnderwritingCenter, ProNavigator, DevSpace, and Kaleidoscope). These forward-looking statements are made as of the date they were first issued and were based on current expectations, estimates, forecasts, and projections as well as the beliefs and assumptions of management. Words such as expect, anticipate, should, believe, hope, target, project, goals, estimate, potential, predict, may, will, might, could, intend, variations of these terms or the negative of these terms and similar expressions are intended to identify these forward-looking statements. Forward-looking statements are subject to a number of risks and uncertainties, many of which involve factors or circumstances that are beyond Guidewire’s control. Guidewire’s actual results could differ materially from those stated or implied in forward-looking statements due to a number of factors, including but not limited to, risks detailed in Guidewire’s most recent Forms 10-K and 10-Q filed with the Securities and Exchange Commission as well as other documents that may be filed by Guidewire from time to time with the Securities and Exchange Commission. In particular, the following factors, among others, could cause results to differ materially from those expressed or implied by such forward-looking statements: fluctuations in our quarterly and annual operating results; our reliance on sales to, and renewals from, a relatively small number of large customers and the related substantial negotiating leverage of these customers; the length and complexity of our sales, product development, and implementation cycles; our competitive environment and changes thereto; our ability to effectively manage international expansion; issues in the development, adoption, deployment, workforce use and maintenance of artificial intelligence (“AI”) and machine learning technologies combined with an uncertain and evolving regulatory environment; long-term pricing commitments made in our customer contracts based on available information; our ability to expand adoption of our cloud-based products and services, and the risk that any of our established products may fail to satisfy customer demands or maintain market acceptance; the impact of seasonal and other variations related to our customer agreements and revenue recognition on our results of operations, ARR, and cash flows; our ability to develop, introduce, and market new and enhanced versions of our products and services; our ability to retain existing and hire new personnel, including managing a hybrid and geographically distributed workforce; errors or failures in our products or services, as well as service interruptions or failure of the third-party service providers we rely on; our dependence on the quality of our professional services and third-party global system integrator partners to sell our products and services; the impact of changes in our revenue mix, and the realization of lower gross margins from our services, subscription, and support revenues compared to our license revenue; the impact of global events (including, without limitation, macroeconomic and geopolitical conditions, ongoing global conflicts, inflation, high interest rates, and general economic volatility); data security breaches of our cloud-based services and products or unauthorized access to our employees’ or our customers’ data; the impact of evolving regulations and laws (including, without limitation, security, privacy, AI and machine learning, tax regulations and laws, and accounting standards); assertions by third parties that we violate their intellectual property rights; stock price volatility regardless of our operating performance; and other risks and uncertainties. Past performance is not indicative of future results. The forward-looking statements included in this press release represent Guidewire’s views as of the date of this press release. Guidewire anticipates that subsequent events and developments will cause its views to change. Guidewire undertakes no intention or obligation to update or revise any forward-looking statements, whether as a result of new information, future events or otherwise. These forward-looking statements should not be relied upon as representing Guidewire’s views as of any date subsequent to the date of this press release.
 View original content to download multimedia:https://www.prnewswire.co.uk/news-releases/guidewire-delivers-the-open-secure-and-complete-core-platform-for-agentic-insurance-302920441.html

27, Oct 2026
Bybit Partners with XAUE Protocol to Offer 2.83% Fixed APR on XAUT Savings
DUBAI, UAE, Oct. 27, 2026 /PRNewswire/ — Bybit, the New Financial Platform trusted by more than 80 million users worldwide, is pleased to launch a new fixed-term XAUT Savings offering in partnership with XAUE Protocol. On Bybit Easy Earn, eligible holders of Tether Gold (XAUT) will receive a 2.83% fixed APR over a 90-day term.
XAUE on Bybit Easy Earn is designed to provide tokenized gold holders with a straightforward yield opportunity within the Bybit ecosystem, allowing XAUT to generate returns while maintaining exposure to the underlying gold-backed asset. The offer is available on a first-come, first-served basis from a total pool of 2,000 XAUT.
XAUE (XAU-Earn) is an institutional-grade, yield-generating gold protocol built on Ethereum. It functions as a treasury and productive layer for Tether Gold (XAU₮). The protocol preserves full exposure to the underlying asset while generating returns measured in gold. The collaboration brings this yield-generation framework to Bybit Earn, extending access to a broader user base through a simple savings subscription model.
The offering goes live on Oct. 26, 2026 at 12:00 UTC with a limited-time rewards pool and first-come, first-served allocation.
Terms and conditions apply. For full details and eligibility, users may visit: Bybit Easy Earn
#Bybit / #NewFinancialPlatform
About Bybit
Bybit is The New Financial Platform.
We believe every person should have access to every financial opportunity on earth. That’s why we’re building the first intelligent platform that connects anyone, anywhere to the world’s finance.
Trusted by more than 80 million users worldwide, Bybit brings together investing, trading, payments, and wealth-building in a single secure and intelligent ecosystem. Through the combination of AI-powered technology, deep global liquidity, robust security, and transparent operations, Bybit makes global finance more accessible, efficient, and empowering for everyone.
Built for everyone. Powered by intelligence. Open to the world.
Learn more at Bybit.com.
For more details about Bybit, please visit Bybit Press
For media inquiries, please contact: media@bybit.com
For updates, please follow: Bybit’s Communities and Social Media
Facebook | Instagram | LinkedIn | Reddit | Telegram | TikTok | X | Youtube
 View original content to download multimedia:https://www.prnewswire.co.uk/news-releases/bybit-partners-with-xaue-protocol-to-offer-2-83-fixed-apr-on-xaut-savings-302920647.html

27, Oct 2026
Cyclone Arnab: Bhubaneswar Airport Keeps Flights Operating, Director Assures Full Preparedness
Bhubaneswar, Oct 27: Flight operations at Biju Patnaik International Airport (BPIA) in Bhubaneswar continued normally on Tuesday, with no cancellations reported as Cyclone Arnab approached the Odisha coast. Airport authorities have completed precautionary preparations and are closely monitoring weather conditions to ensure passenger safety.

Representational Image
BPIA Director Prasanna Pradhan said the airport was operating as usual, as the prevailing weather forecast did not indicate conditions severe enough to warrant a shutdown. However, he clarified that officials remain on alert and any operational decisions would depend on changes in the weather and prevailing safety requirements.
Airport Completes Pre-Cyclone Preparations
According to Pradhan, the airport has implemented its prescribed Standard Operating Procedures (SOPs), technical instructions and operational guidelines to prepare for the potential impact of the cyclone.
A coordination meeting with relevant stakeholders was also held to review preparedness and ensure that necessary arrangements were in place to respond to changing weather conditions.
“We have completed our pre-cyclonic preparedness measures. Based on the forecast from the Meteorological Department, Bhubaneswar is not impacted severely enough to warrant a shutdown of flight operations. However, we are fully alert for any situation. If required, we will make a decision at that time,” Pradhan said.
Flight Safety Remains the Priority
The airport director said flight operations would continue as long as weather conditions remained suitable for safe flying. In the event of rain or other weather-related challenges, decisions would be taken by pilots and relevant authorities in accordance with established safety procedures.
Airport officials are also prepared to manage possible flight delays or diversions if conditions deteriorate. The arrangements are intended to maintain operational safety while minimising inconvenience to passengers.
Cyclone Arnab has intensified into a severe cyclonic storm and is moving at a reported speed of around 20 kmph. Rain and strong winds have been reported in parts of Odisha, while further deterioration in weather conditions was expected on Tuesday night, according to the report.
Passengers Urged to Check Flight Status
With weather conditions potentially changing at short notice, Pradhan has advised air travellers to remain calm and verify their flight status before leaving for the airport.
“Please do not panic. Just check your flight status before leaving home. That is my advice. Please check your flight status before coming to the airport,” he said.
Passengers are advised to check updates directly with their respective airlines and allow sufficient time for their journeys. Although flight services were operating normally at the time of the statement, schedules could be affected if weather conditions worsen.
Airport authorities will continue to assess the situation and take necessary measures in line with official weather forecasts and aviation safety requirements as Cyclone Arnab approaches the Odisha coast.
27, Oct 2026
ROYAL CARIBBEAN GROUP REPORTS THIRD QUARTER RESULTS ABOVE EXPECTATIONS AND RAISES FULL YEAR GUIDANCE
MIAMI, Oct. 27, 2026 /PRNewswire/ — Royal Caribbean Group (NYSE: RCL) today reported third quarter Earnings per Share (“EPS”) of $6.45 and Adjusted EPS of $6.57. These results were better than the company’s guidance, driven by strong close-in demand and lower costs due to timing. The company now expects full year Adjusted EPS to be in the range of $17.85 to $17.95. The increase in earnings expectations reflects the stronger-than-expected third quarter performance partially offset by higher than anticipated fuel costs (based on current at-the-pump rates) and currency exchange rates.

“Our third quarter results reflect continued strong consumer demand for our vacation experiences and the accelerated momentum across our industry leading brands,” said Jason Liberty, Chairman and CEO, Royal Caribbean Group. “Our strategy to turn the vacation of a lifetime into a lifetime of vacations is propelling our business by leveraging our leading brands, differentiated experiences, loyalty platform and technology capabilities to deepen guest relationships, increase vacation frequency and capture a greater share of the growing global vacation market. Taking further advantage of our leading vacation platform, the recently announced partnership with Sandals and Beaches Resorts is intended to drive significant shareholder value as we expand our vacation ecosystem, giving guests more ways to vacation with us across more occasions.”
“Demand for our leading vacation experiences remains strong, and while it is still early, 2027 bookings are pacing ahead of historical levels at higher rates,” Liberty continued. “2027 also marks the final year of our Perfecta target period. The underlying business is performing well ahead of our initial expectations, and based on the forward fuel curve, we remain on track to achieve our Perfecta goals of delivering 20% Adjusted EPS CAGR from 2024 through 2027, or a $20-handle in 2027. We are currently already above our ROIC target.”
Third Quarter 2026:
- Total revenue was $5.6 billion, a 9% increase year over year. Load factor in the third quarter was 112%.
- Gross Margin Yields decreased 0.8% as-reported. Net Yields increased 0.9% as-reported and 0.6% in Constant Currency, driven by better-than-expected close-in demand in Europe and the Caribbean.
- Gross Cruise Costs per Available Passenger Cruise Days (“APCD”) decreased 0.7% as-reported. Net Cruise Costs (“NCC”), excluding Fuel, per APCD decreased 1.9% as-reported and 1.8% in Constant Currency, due to the timing of expenses that shifted into the fourth quarter.
- Net Income was $1.7 billion or $6.45 per share, Adjusted Net Income was $1.8 billion or $6.57 per share, and Adjusted EBITDA was $2.5 billion.
Full Year 2026 Outlook:
- Revenue is expected to grow 9% year over year. Net Yields are expected to increase approximately 2.7% as-reported and approximately 2.1% in Constant Currency.
- NCC, excluding Fuel, per APCD are expected to increase approximately 0.4% as-reported and be approximately flat in Constant Currency.
- Adjusted EPS is expected to be in the range of $17.85 to $17.95.
Sandals and Beaches Resorts Partnership
In September, Royal Caribbean Group announced an agreement to acquire a 50% interest in Sandals and Beaches Resorts, expanding the company’s vacation platform into the all-inclusive resort category. The Sandals and Beaches Resorts’ portfolio includes 18 resorts across the Caribbean and three resorts under development. It also includes over 1,000 acres of undeveloped land in the Caribbean, including acreage adjacent to existing resorts, creating a meaningful runway for continued growth.
Sandals and Beaches are leading brands in the all-inclusive resort category, with high brand awareness, strong guest satisfaction and a loyal customer base. The portfolio has benefited from significant investment in recent years, including physical upgrades across the resorts and continued enhancements to the guest experience. The partnership will preserve the identity, operating leadership, and Caribbean character of the brands, while providing additional resources and capabilities to support continued value creation. Approximately 30% of Royal Caribbean Group guests also take all-inclusive vacations, while a similar percentage of Sandals and Beaches guests also cruise, creating a significant opportunity to introduce each portfolio to new guests and capture a greater share of the vacations they already take.
“Our mission is to deliver the best vacation experiences responsibly. Sandals and Beaches Resorts extend our platform into an attractive adjacent category, unlocking more ways to deliver on that mission,” said Jason Liberty, Chairman and CEO, Royal Caribbean Group. “Underpinned by the strength and significant growth opportunities of our core business, this investment accelerates our strategy to capture a greater share of the rapidly growing vacation market. By bringing together Sandals and Beaches’ hospitality and Caribbean expertise with our global commercial reach, loyalty and technology capabilities, we see meaningful opportunities to reach new guests, increase vacation frequency, and leverage our combined scale to create additional synergies and value over time.”
The investment is expected to close in early 2027, subject to customary closing conditions and regulatory approvals. The company’s share of earnings from Sandals and Beaches Resorts is expected to be immediately accretive, with contribution in 2027 dependent on the timing of the transaction close. The investment is expected to be accounted for under the equity method, with results reported on a one-quarter lag. The expected contribution from Sandals and Beaches Resorts will be incorporated into the company’s 2027 guidance, along with related detail, upon closing.
Third Quarter 2026 Results
Net Income for the third quarter of 2026 was $1.7 billion or $6.45 per share compared to Net Income of $1.6 billion or $5.74 per share for the same period in the prior year. Adjusted Net Income was $1.8 billion or $6.57 per share for the third quarter of 2026 compared to Adjusted Net Income of $1.6 billion or $5.75 per share for the same period in the prior year. The company also reported total revenues of $5.6 billion and Adjusted EBITDA of $2.5 billion.
Capacity for the third quarter was up 8% year over year and the company delivered memorable vacations to 2.7 million guests, a 9% increase year over year. Total revenue increased 9% year over year. Gross Margin Yields decreased 0.8% as-reported, and Net Yields increased 0.9% as-reported (0.6% in Constant Currency), when compared to the third quarter of 2025. Load factor for the quarter was 112%. Net Yield growth exceeded the company’s guidance primarily driven by better than expected close-in demand in Europe and the Caribbean.
Gross Cruise Costs per APCD decreased 0.7% as-reported, compared to the third quarter of 2025. NCC, excluding Fuel, per APCD decreased 1.9% as-reported (and decreased 1.8% in Constant Currency), when compared to the third quarter of 2025. The better-than-expected cost performance in the third quarter was due to the timing of expenses that shifted into the fourth quarter.
Demand, Bookings and Vacation Platform
Since the last earnings call, booking volumes have increased in the mid-teens across all major channels, with bookings for 2027 sailings up in the high teens, demonstrating strong demand as booking activity builds for 2027.
The company continues to see strong engagement across the vacation journey. Third quarter pre-cruise and onboard revenue rates were ahead of prior year, and fourth quarter pre-cruise revenue rates are also booked ahead of last year. The company’s expanding range of products and services, together with its technology capabilities, is enabling more relevant and personalized engagement by connecting guests with the right experiences at the right time.
Fourth Quarter 2026
In line with the company’s prior expectation, Net Yields are expected to be 4.4% to 4.9% as-reported and 4.2% to 4.7% in Constant Currency as compared to 2025. Net Yield growth is driven by strong demand, a more favorable year-over-year comparison, deployment mix, and the timing of dry docks. Total revenue is expected to grow 9%.
NCC, excluding Fuel, per APCD is expected to decrease 1.5% to 1.0% as-reported and 1.4% to 0.9% in Constant Currency as compared to 2025.
Based on current fuel pricing, interest rates, currency exchange rates and the factors detailed above, the company expects fourth quarter Adjusted EPS to be in the range of $3.48 to $3.58.
Fuel Expense
Bunker pricing, net of hedging, for the third quarter was $778 per metric ton and consumption was 446,000 metric tons.
The company does not forecast fuel prices and its fuel cost calculations are based on current at-the-pump prices, net of hedging impacts. Based on current fuel prices, the company has included $379 million of fuel expense in its fourth quarter guidance, which is 58% hedged via swaps at a forecasted consumption of 463,000 metric tons.
Forecasted consumption is 58%, 53%, 29%, and 14% hedged via swaps for 2026, 2027, 2028, and 2029 respectively. The annual average cost per metric ton of the hedge portfolio is approximately $471, $405, $424, and $451 for 2026, 2027, 2028, and 2029 respectively.
The company provided the following guidance for the fourth quarter and full year 2026:
|
FUEL STATISTICS |
Fourth Quarter 2026 |
Full Year 2026 |
|
Fuel Consumption (metric tons) |
463,000 |
1,763,000 |
|
Fuel Expenses |
$379 million |
$1,345 million |
|
Fourth Quarter 2026 |
Remainder of Year 2026 |
|
|
Percent Hedged (fwd. consumption) |
58.0 % |
58.0 % |
|
GUIDANCE |
As-Reported |
Constant Currency |
|
Fourth Quarter 2026 |
||
|
Net Yields vs. 2025 |
4.4% to 4.9% |
4.2% to 4.7% |
|
Net Cruise Costs per APCD vs. 2025 |
1.9% to 2.4% |
2.0% to 2.5% |
|
Net Cruise Costs per APCD ex. Fuel vs. 2025 |
(1.5%) to (1.0%) |
(1.4%) to (0.9%) |
|
Full Year 2026 |
||
|
Net Yields vs. 2025 |
Approximately 2.7% |
Approximately 2.1% |
|
Net Cruise Costs per APCD vs. 2025 |
Approximately 1.8% |
Approximately 1.5% |
|
Net Cruise Costs per APCD ex. Fuel vs. 2025 |
Approximately 0.4% |
Approximately Flat |
|
GUIDANCE |
Fourth Quarter 2026 |
Full Year 2026 |
|
APCDs |
14.7 million |
56.8 million |
|
Capacity change vs. 2025 |
5.0 % |
6.6 % |
|
Depreciation and amortization |
$460 to $470 million |
$1,870 to $1,890 million |
|
Net Interest, excluding loss on extinguishment of debt |
$255 to $265 million |
$995 to $1,005 million |
|
Adjusted EPS |
$3.48 to $3.58 |
$17.85 to $17.95 |
|
SENSITIVITY |
Fourth Quarter 2026 |
Full Year 2026 |
|
1% Change in Net Yields |
$37 million |
$155 million |
|
1% Change in NCC excluding Fuel |
$19 million |
$73 million |
|
Fourth Quarter 2026 |
Remainder of Year 2026 |
|
|
1% Change in Currency |
$6 million |
$6 million |
|
10% Change in Fuel prices |
$15 million |
$15 million |
|
100 basis pt. Change in SOFR |
$0.3 million |
$0.3 million |
|
Exchange rates used in guidance calculations |
||
|
GBP |
$1.32 |
|
|
AUD |
$0.70 |
|
|
CAD |
$0.70 |
|
|
EUR |
$1.12 |
|
Liquidity
As of September 30, 2026, the company’s liquidity position was $7.4 billion, which includes cash and cash equivalents and undrawn revolving credit facility capacity. During the quarter, the company issued $1.25 billion of 5.550% senior unsecured notes due 2034. The proceeds were used to repay a portion of the company’s floating-rate term loan facilities and debt maturing in 2027.
In October, the company entered into a $400 million delayed-draw term loan with Export Development Canada (EDC), Canada’s export credit agency, representing a new source of capital. The facility includes terms and covenants that are generally consistent with the company’s existing revolving credit facility. In addition, the company increased its revolving credit facility by $50 million, for a total capacity of $6.65 billion.
The company noted that as of September 30, 2026, the scheduled debt maturities for 2026, 2027, 2028, 2029 and 2030 were $0.6 billion, $2.4 billion, $3.2 billion, $1.1 billion, and $1.1 billion respectively.
Capital Expenditures and Capacity Guidance
Capital expenditures for the full year 2026 are expected to be approximately $4.6 billion, based on current foreign exchange rates, and are predominantly related to the company’s new ship order book and land-based destination initiatives. Non-new ship related capital expenditures are expected to be $1.5 billion.
Capacity changes for 2026 are expected to be 6.6% compared to 2025. Capacity changes for 2027, 2028, and 2029 are expected to be approximately 4.5%, 6.0%, and 6.5%, respectively. These figures do not include potential ship sales or additions that the company may elect in the future.
Conference call scheduled
The company has scheduled a conference call at 10 a.m. Eastern Time today. This call can be heard, either live or on a delayed basis, on the company’s investor relations website at www.rclinvestor.com.
Definitions
Selected Operational and Financial Metrics
Adjusted Earnings per Share (“Adjusted EPS”) is a non-GAAP measure that represents Adjusted Net Income attributable to Royal Caribbean Cruises Ltd. (as defined below) divided by basic weighted average shares outstanding or by diluted weighted average shares outstanding, as applicable. We believe that this non-GAAP measure is meaningful when assessing our performance on a comparative basis.
Adjusted EBITDA is a non-GAAP measure that represents EBITDA (as defined below) excluding certain items that we believe adjusting for is meaningful when assessing our profitability on a comparative basis. For the periods presented, these items included (i) other (income) expense; (ii) restructuring charges and other initiative expenses; and (iii) equity investment impairment, (recovery) of losses and other.
Adjusted EBITDA Margin is a non-GAAP measure that represents Adjusted EBITDA (as defined above) divided by total revenues.
Adjusted Gross Margin represents Gross Margin, adjusted for payroll and related, food, fuel, other operating, and depreciation and amortization expenses. Gross Margin is calculated pursuant to GAAP as total revenues less total cruise operating expenses, and depreciation and amortization expenses.
Adjusted Net Income attributable to Royal Caribbean Cruises Ltd. is a non-GAAP measure that represents Net Income attributable to Royal Caribbean Cruises Ltd., excluding certain items that we believe adjusting for is meaningful when assessing our performance on a comparative basis. For the periods presented, these items included (i) loss on extinguishment of debt and inducement expense; (ii) restructuring charges and other initiative expenses; (iii) the amortization of the Silversea intangible assets resulting from the Silversea acquisition; (iv) gain on sale of noncontrolling interest; and (v) equity investment impairment, (recovery) of losses, and other.
Adjusted Operating Income is a non-GAAP measure that represents operating income including income from equity investments and provision for income taxes but excluding certain items for which we believe adjusting for is meaningful when assessing our operating performance on a comparative basis. We use this non-GAAP measure to calculate ROIC (as defined below).
Available Passenger Cruise Days (“APCD”) is our measurement of capacity and represents double occupancy per cabin multiplied by the number of cruise days for the period, which excludes canceled cruise days and cabins not available for sale. We use this measure to perform capacity and rate analysis to identify our main non-capacity drivers that cause our cruise revenue and expenses to vary.
Constant Currency is a significant measure for our revenues and expenses, which are denominated in currencies other than the U.S. Dollar. Because our reporting currency is the U.S. Dollar, the value of these revenues and expenses in U.S. Dollar will be affected by changes in currency exchange rates. Although such changes in local currency prices are just one of many elements impacting our revenues and expenses, it can be an important element. For this reason, we also monitor our revenues and expenses in “Constant Currency” – i.e., as if the current period’s currency exchange rates had remained constant with the comparable prior period’s rates. We calculate “Constant Currency” by applying the average of the prior period exchange rates for each of the corresponding months, of the reported and/or forecasted period, so as to calculate what the results would have been had exchange rates been the same throughout both periods. We do not make predictions about future exchange rates and use current exchange rates for calculations of future periods. It should be emphasized that the use of Constant Currency is primarily used by us for comparing short-term changes and/or projections. Over the longer term, changes in guest sourcing and shifting the amount of purchases between currencies can significantly change the impact of the purely currency-based fluctuations.
EBITDA is a non-GAAP measure that represents Net Income attributable to Royal Caribbean Cruises Ltd. excluding (i) interest income; (ii) interest expense, net of interest capitalized; (iii) depreciation and amortization expenses; and (iv) provision for income taxes. We believe that this non-GAAP measure is meaningful when assessing our operating performance on a comparative basis.
Gross Cruise Costs represent the sum of total cruise operating expenses plus marketing, selling and administrative expenses.
Gross Margin Yield represent Gross Margin per APCD.
Invested Capital represents the most recent five-quarter average of total debt (i.e., Current portion of long-term debt plus Long-term debt) plus the most recent five-quarter average of Total shareholders’ equity. We use this measure to calculate ROIC (as defined below).
Net Cruise Costs and Net Cruise Costs excluding Fuel are non-GAAP measures that represent Gross Cruise Costs excluding commissions, transportation and other expenses, and onboard and other expenses and, in the case of Net Cruise Costs excluding Fuel, fuel expenses. In measuring our ability to control costs in a manner that positively impacts net income, we believe changes in Net Cruise Costs and Net Cruise Costs excluding Fuel to be the most relevant indicators of our cost performance. For the periods presented, Net Cruise Costs and Net Cruise Costs excluding Fuel exclude restructuring charges and other initiative expenses.
Net Yields represent Adjusted Gross Margin per APCD. We utilize Adjusted Gross Margin and Net Yields to manage our business on a day-to-day basis as we believe that they are the most relevant measures of our pricing performance because they reflect the cruise revenues earned by us net of our most significant variable costs, which are commissions, transportation and other expenses, and onboard and other expenses.
Occupancy (“Load factor”), in accordance with cruise vacation industry practice, is calculated by dividing Passenger Cruise Days (as defined below) by APCD. A percentage in excess of 100% indicates that three or more passengers occupied some cabins.
Passenger Cruise Days (“PCD”) represent the number of passengers carried for the period multiplied by the number of days of their respective cruises.
Perfecta Program refers to the multi-year Adjusted EPS and ROIC goals we are seeking to achieve by end of 2027. Under our Perfecta Program, we are targeting 20% compound annual growth rate in Adjusted EPS compared to 2024 and ROIC of 17% or higher by the end of 2027.
Return on Invested Capital (“ROIC”) represents Adjusted Operating Income divided by Invested Capital. We believe ROIC is a meaningful measure because it quantifies how efficiently we generated operating income relative to the capital we have invested in the business.
For additional information see “Adjusted Measures of Financial Performance” below.
About Royal Caribbean Group
Royal Caribbean Group is a leading global vacation company spanning cruise, exclusive destinations, and land-based vacation experiences. The company operates 71 ships sailing to more than 1,000 destinations across all seven continents through its three wholly owned brands – Royal Caribbean, Celebrity Cruises, and Silversea – and a 50% joint venture interest in TUI Cruises which operates the Mein Schiff and Hapag-Lloyd brands.
The Group is expanding its portfolio of private destinations through its Perfect Day and Royal Beach Club collections, and the company will enter river cruising in 2027 with Celebrity River Cruises. Powered by innovative brands, advanced technology, and an industry-leading loyalty program, the company has built a connected vacation ecosystem, turning the vacation of a lifetime into a lifetime of vacations.
Named to the Fortune World’s Most Admired Companies 2026 list and to Forbes’ 2026 Best American Companies lists, Royal Caribbean Group is guided by its mission to deliver the best vacations responsibly. For more information, visit www.royalcaribbeangroup.com.
Cautionary Statement Concerning Forward-Looking Statements
Certain statements in this press release relating to, among other things, our future performance estimates, forecasts and projections constitute forward-looking statements under the Private Securities Litigation Reform Act of 1995. These statements include, but are not limited to: statements regarding the benefits and expected impact of the proposed joint venture with Sandals and Beaches Resorts, including the timing of the closing of the transaction, earnings impact, and anticipated growth, expansion and future opportunities for the joint venture; statements regarding revenues, costs and financial results for 2026 and beyond; anticipated timing for launch of private destinations; our progress toward achievement of our Perfecta program; demand for our brands; expectations on river cruise offerings; future capital expenditures; and expectations regarding our credit profile and fuel expenses. Words such as “anticipate,” “believe,” “committed,” “could,” “driving,” “estimate,” “expect,” “goal,” “intend,” “may,” “plan,” “encouraged,” “project,” “shaping up,” “position,” “allows,” “seek,” “should,” “will,” “would,” “considering,” and similar expressions are intended to help identify forward-looking statements. Forward-looking statements reflect management’s current expectations, are based on judgments, are inherently uncertain and are subject to risks, uncertainties and other factors, which could cause our actual results, performance or achievements to differ materially from the future results, performance or achievements expressed or implied in those forward-looking statements. Examples of these risks, uncertainties and other factors include, but are not limited to, the following: the impact of the economic and geopolitical environment, including changing tariffs and the related uncertainty thereof, on key aspects of our business, such as the demand for cruises, passenger spending, and operating costs; changes in operating costs; the unavailability or cost of air service; disease outbreaks and increased concern about the risk of illness on our ships or when travelling to or from our ships, which could cause a decrease in demand, guest cancellations, and ship redeployments; incidents or adverse publicity concerning our ships, port facilities, land destinations and/or passengers or the cruise vacation industry in general; the effects of weather, climate events and/or natural disasters on our business; risks related to our sustainability activities; the impact of issues at shipyards, including ship delivery delays, ship cancellations or ship construction cost increases; shipyard unavailability; unavailability of ports of call; vacation industry competition and increase in industry capacity and overcapacity; inability to manage our cost and capital allocation strategies; the uncertainties of conducting business globally and expanding into new markets and new ventures, including potential acquisitions; issues with travel advisers that sell and market our cruises; reliance on third-party service providers; potential unavailability of insurance coverage; the risks and costs related to cyber security attacks, data breaches, protecting our systems and maintaining data integrity and security; uncertainties of a foreign legal system as we are not incorporated in the United States; our ability to obtain sufficient financing or capital to fund our capital expenditures, operations, debt repayments and other financing needs; our expectation and ability to pay a cash dividend on our common stock in the future; changes to our dividend policy; growing anti-tourism sentiments and environmental concerns; changes in U.S. or other countries’ foreign travel policy; impact of new or changing legislation and regulations (including environmental regulations) or governmental orders on our business; fluctuations in foreign currency exchange rates, fuel prices and interest rates; further impairments of our goodwill, long-lived assets, equity investments and notes receivable; an inability to source our crew or our provisions and supplies from certain places; our ability to recruit, develop and retain high quality personnel; and pending or threatened litigation, investigations and enforcement actions.
More information about factors that could affect our operating results is included under the caption “Risk Factors” in our most recent annual report on Form 10-K, as well as our other filings with the SEC, copies of which may be obtained by visiting our Investor Relations website at www.rclinvestor.com or the SEC’s website at www.sec.gov. Undue reliance should not be placed on the forward-looking statements in this release, which are based on information available to us on the date hereof. We undertake no obligation to publicly update or revise any forward-looking statements, whether as a result of new information, future events or otherwise.
Adjusted Measures of Financial Performance
This press release includes certain adjusted financial measures defined as non-GAAP financial measures under Securities and Exchange Commission rules, which we believe provide useful information to investors as a supplement to our consolidated financial statements, which are prepared and presented in accordance with generally accepted accounting principles, or U.S. GAAP.
The presentation of adjusted financial information is not intended to be considered in isolation or as a substitute for, or superior to, the financial information prepared and presented in accordance with U.S. GAAP. These measures may be different from adjusted measures used by other companies. In addition, these adjusted measures are not based on any comprehensive set of accounting rules or principles. Adjusted measures have limitations in that they do not reflect all of the amounts associated with our results of operations as do the corresponding U.S. GAAP measures.
A reconciliation to the most comparable U.S. GAAP measure of all adjusted financial measures included in this press release can be found in the tables included at the end of this press release. We have not provided a quantitative reconciliation of the projected non-GAAP financial measures to the most comparable GAAP financial measures because preparation of meaningful U.S. GAAP projections would require unreasonable effort. Due to significant uncertainty, we are unable to predict, without unreasonable effort, the future movement of foreign exchange rates, fuel prices and interest rates inclusive of our related hedging programs. In addition, we are unable to determine the future impact of non-core business related gains and losses which may result from strategic initiatives. These items are uncertain and could be material to our results of operations in accordance with U.S. GAAP. Due to this uncertainty, we do not believe that reconciling information for such projected figures would be meaningful.
|
ROYAL CARIBBEAN CRUISES LTD. |
|||||||
|
CONSOLIDATED STATEMENTS OF COMPREHENSIVE INCOME (LOSS) |
|||||||
|
(unaudited, in millions, except per share data) |
|||||||
|
Quarter Ended |
Nine Months Ended |
||||||
|
September 30, |
September 30, |
||||||
|
2026 |
2025 |
2026 |
2025 |
||||
|
Passenger ticket revenues |
$ 3,885 |
$ 3,637 |
$ 10,250 |
$ 9,579 |
|||
|
Onboard and other revenues |
1,706 |
1,502 |
4,625 |
4,097 |
|||
|
Total revenues |
5,591 |
5,139 |
14,876 |
13,676 |
|||
|
Cruise operating expenses: |
|||||||
|
Commissions, transportation and other |
735 |
696 |
1,921 |
1,823 |
|||
|
Onboard and other |
338 |
312 |
838 |
775 |
|||
|
Payroll and related |
399 |
342 |
1,204 |
1,010 |
|||
|
Food |
287 |
264 |
813 |
750 |
|||
|
Fuel |
347 |
297 |
966 |
854 |
|||
|
Other operating |
606 |
569 |
1,763 |
1,630 |
|||
|
Total cruise operating expenses |
2,711 |
2,479 |
7,506 |
6,841 |
|||
|
Marketing, selling and administrative expenses |
519 |
522 |
1,615 |
1,593 |
|||
|
Depreciation and amortization expenses |
490 |
435 |
1,415 |
1,265 |
|||
|
Operating Income |
1,871 |
1,702 |
4,340 |
3,977 |
|||
|
Other income (expense): |
|||||||
|
Interest income |
5 |
3 |
15 |
17 |
|||
|
Interest expense, net of interest capitalized |
(291) |
(248) |
(805) |
(725) |
|||
|
Equity investment income |
176 |
158 |
328 |
313 |
|||
|
Other income (expense) |
1 |
(2) |
10 |
13 |
|||
|
Income before income taxes |
1,762 |
1,612 |
3,887 |
3,596 |
|||
|
Provision for income taxes |
(27) |
(34) |
(66) |
(67) |
|||
|
Net Income |
1,735 |
1,579 |
3,821 |
3,529 |
|||
|
Less: Net Income attributable to noncontrolling interest |
7 |
4 |
23 |
15 |
|||
|
Net Income attributable to Royal Caribbean Cruises Ltd. |
$ 1,728 |
$ 1,575 |
$ 3,798 |
$ 3,514 |
|||
|
Earnings per Share: |
|||||||
|
Basic |
$ 6.46 |
$ 5.79 |
$ 14.15 |
$ 12.97 |
|||
|
Diluted |
$ 6.45 |
$ 5.74 |
$ 14.12 |
$ 12.83 |
|||
|
Weighted-Average Shares Outstanding: |
|||||||
|
Basic |
267 |
272 |
268 |
271 |
|||
|
Diluted |
268 |
274 |
269 |
275 |
|||
|
Comprehensive Income (Loss) |
|||||||
|
Net Income |
$ 1,735 |
$ 1,579 |
$ 3,821 |
$ 3,529 |
|||
|
Other comprehensive income (loss): |
|||||||
|
Foreign currency translation adjustments |
(6) |
(2) |
(6) |
(28) |
|||
|
Change in defined benefit plans |
7 |
(2) |
11 |
(2) |
|||
|
Gain (loss) on cash flow derivative hedges |
131 |
(5) |
215 |
304 |
|||
|
Total other comprehensive income (loss) |
133 |
(9) |
220 |
274 |
|||
|
Comprehensive Income |
1,868 |
1,570 |
4,042 |
3,803 |
|||
|
Less: Comprehensive Income attributable to noncontrolling interest |
7 |
4 |
23 |
15 |
|||
|
Comprehensive Income attributable to Royal Caribbean Cruises Ltd. |
$ 1,861 |
$ 1,566 |
$ 4,018 |
$ 3,788 |
|||
|
Certain amounts may not add or calculate due to use of rounded numbers. |
|
ROYAL CARIBBEAN CRUISES LTD. |
|||||||
|
STATISTICS |
|||||||
|
(unaudited) |
|||||||
|
Quarter Ended |
Nine Months Ended |
||||||
|
September 30, |
September 30, |
||||||
|
2026 |
2025 |
2026 |
2025 |
||||
|
Passengers Carried |
2,676,480 |
2,466,039 |
7,567,360 |
6,961,768 |
|||
|
Passenger Cruise Days |
16,692,392 |
15,356,271 |
46,527,802 |
43,402,497 |
|||
|
APCD |
14,844,688 |
13,698,886 |
42,119,787 |
39,299,263 |
|||
|
Occupancy |
112.4 % |
112.1 % |
110.5 % |
110.4 % |
|||
|
ROYAL CARIBBEAN CRUISES LTD. |
|||
|
CONSOLIDATED BALANCE SHEETS |
|||
|
(in millions, except share data) |
|||
|
As of |
|||
|
September 30, |
December 31, |
||
|
2026 |
2025 |
||
|
(unaudited) |
|||
|
Assets |
|||
|
Current assets |
|||
|
Cash and cash equivalents |
$ 851 |
$ 825 |
|
|
Trade and other receivables, net |
409 |
317 |
|
|
Inventories |
304 |
264 |
|
|
Prepaid expenses and other assets |
750 |
690 |
|
|
Derivative financial instruments |
160 |
115 |
|
|
Total current assets |
2,474 |
2,211 |
|
|
Property and equipment, net |
38,297 |
35,696 |
|
|
Operating lease right-of-use assets |
751 |
620 |
|
|
Goodwill |
808 |
808 |
|
|
Other assets |
2,483 |
2,284 |
|
|
Total assets |
$ 44,813 |
$ 41,619 |
|
|
Liabilities and Shareholders’ Equity |
|||
|
Current liabilities |
|||
|
Current portion of long-term debt |
$ 2,239 |
$ 3,180 |
|
|
Current portion of operating lease liabilities |
71 |
90 |
|
|
Accounts payable |
979 |
953 |
|
|
Accrued expenses and other liabilities |
1,983 |
2,026 |
|
|
Derivative financial instruments |
107 |
67 |
|
|
Customer deposits |
6,034 |
5,739 |
|
|
Total current liabilities |
11,413 |
12,055 |
|
|
Long-term debt |
20,116 |
18,165 |
|
|
Long-term operating lease liabilities |
744 |
600 |
|
|
Other long-term liabilities |
627 |
554 |
|
|
Total liabilities |
32,900 |
31,374 |
|
|
Shareholders’ equity |
|||
|
Preferred stock ($0.01 par value; 20,000,000 shares authorized; none outstanding) |
— |
— |
|
|
Common stock ($0.01 par value; 500,000,000 shares authorized; 303,899,853 and 303,054,848 shares |
3 |
3 |
|
|
Paid-in capital |
7,916 |
7,964 |
|
|
Retained earnings |
8,512 |
5,925 |
|
|
Accumulated other comprehensive loss |
(384) |
(604) |
|
|
Treasury stock (36,429,278 and 32,631,826 common shares at cost, at September 30, 2026 and |
(4,334) |
(3,251) |
|
|
Total shareholders’ equity attributable to Royal Caribbean Cruises Ltd. |
11,713 |
10,037 |
|
|
Noncontrolling Interest |
200 |
208 |
|
|
Total shareholders’ equity |
11,913 |
10,245 |
|
|
Total liabilities and shareholders’ equity |
$ 44,813 |
$ 41,619 |
|
|
ROYAL CARIBBEAN CRUISES LTD. |
|||
|
CONSOLIDATED STATEMENTS OF CASH FLOW |
|||
|
(unaudited; in millions) |
|||
|
Nine Months Ended September 30, |
|||
|
2026 |
2025 |
||
|
Operating Activities |
|||
|
Net Income |
$ 3,821 |
$ 3,529 |
|
|
Adjustments: |
|||
|
Depreciation and amortization |
1,415 |
1,265 |
|
|
Net deferred income tax (benefit) expense |
(5) |
15 |
|
|
Loss (Gain) on derivative instruments not designated as hedges |
4 |
(45) |
|
|
Share-based compensation expense |
94 |
136 |
|
|
Equity investment income |
(328) |
(313) |
|
|
Amortization of debt issuance costs, discounts and premiums |
16 |
72 |
|
|
Loss on extinguishment of debt and inducement expense |
105 |
10 |
|
|
Changes in operating assets and liabilities: |
|||
|
Increase in trade and other receivables, net |
(109) |
(34) |
|
|
Increase in inventories |
(40) |
(4) |
|
|
Increase in prepaid expenses and other assets |
(112) |
(42) |
|
|
Decrease in accounts payable |
(60) |
(100) |
|
|
(Decrease) increase in accrued expenses and other liabilities |
(220) |
19 |
|
|
Increase in customer deposits |
295 |
108 |
|
|
Dividends received from unconsolidated affiliates |
309 |
263 |
|
|
Other, net |
89 |
(37) |
|
|
Net cash provided by operating activities |
5,274 |
4,842 |
|
|
Investing Activities |
|||
|
Purchases of property and equipment |
(3,880) |
(3,722) |
|
|
Cash received on settlement of derivative financial instruments |
122 |
144 |
|
|
Cash paid on settlement of derivative financial instruments |
(27) |
(12) |
|
|
Investments in and loans to unconsolidated affiliates |
(49) |
(94) |
|
|
Cash received on loans from unconsolidated affiliates |
— |
126 |
|
|
Other, net |
2 |
25 |
|
|
Net cash used in investing activities |
(3,832) |
(3,533) |
|
|
Financing Activities |
|||
|
Debt proceeds |
7,227 |
3,162 |
|
|
Debt issuance costs |
(124) |
(100) |
|
|
Repayments of debt |
(6,236) |
(3,075) |
|
|
Repurchase of common stock |
(1,035) |
(655) |
|
|
Dividends paid |
(1,075) |
(552) |
|
|
Payments of withholding tax on stock awards |
(191) |
(63) |
|
|
Other, net |
19 |
11 |
|
|
Net cash used in financing activities |
(1,415) |
(1,272) |
|
|
Effect of exchange rate changes on cash and cash equivalents |
(1) |
7 |
|
|
Net increase in cash and cash equivalents |
26 |
44 |
|
|
Cash and cash equivalents at beginning of period |
825 |
388 |
|
|
Cash and cash equivalents at end of period |
$ 851 |
$ 432 |
|
|
Supplemental Disclosure |
|||
|
Cash paid during the period for: |
|||
|
Interest, net of amount capitalized |
$ 739 |
$ 709 |
|
|
Non-cash Investing Activities |
|||
|
Purchase of property and equipment included in accounts payable and accrued expenses and other liabilities |
$ 137 |
$ 83 |
|
|
ROYAL CARIBBEAN CRUISES LTD. |
|||||||||||
|
NON-GAAP RECONCILING INFORMATION |
|||||||||||
|
(unaudited) |
|||||||||||
|
Gross Margin Yields, Net Yields and Adjusted Gross Margin per PCD are calculated as follows (in millions, except APCD, PCD, Yields, and Adjusted Gross |
|||||||||||
|
Quarter Ended September 30, |
Nine Months Ended September 30, |
||||||||||
|
2026 |
2026 On a |
2025 |
2026 |
2026 On a |
2025 |
||||||
|
Total revenues |
$ 5,591 |
$ 5,579 |
$ 5,139 |
$ 14,876 |
$ 14,767 |
$ 13,676 |
|||||
|
Less: |
|||||||||||
|
Cruise operating expenses |
2,711 |
2,715 |
2,479 |
7,506 |
7,478 |
6,841 |
|||||
|
Depreciation and amortization expenses |
490 |
490 |
435 |
1,415 |
1,419 |
1,265 |
|||||
|
Gross Margin |
2,390 |
2,374 |
2,225 |
5,955 |
5,870 |
5,570 |
|||||
|
Add: |
|||||||||||
|
Payroll and related |
399 |
399 |
342 |
1,204 |
1,204 |
1,010 |
|||||
|
Food |
287 |
287 |
264 |
813 |
813 |
750 |
|||||
|
Fuel |
347 |
347 |
297 |
966 |
967 |
854 |
|||||
|
Other operating |
606 |
609 |
569 |
1,763 |
1,748 |
1,630 |
|||||
|
Depreciation and amortization expenses |
490 |
490 |
435 |
1,415 |
1,419 |
1,265 |
|||||
|
Adjusted Gross Margin |
$ 4,519 |
$ 4,506 |
$ 4,131 |
$ 12,116 |
$ 12,021 |
$ 11,077 |
|||||
|
APCD |
14,844,688 |
14,844,688 |
13,698,886 |
42,119,787 |
42,119,787 |
39,299,263 |
|||||
|
Passenger Cruise Days |
16,692,392 |
16,692,392 |
15,356,271 |
46,527,802 |
46,527,802 |
43,402,497 |
|||||
|
Gross Margin Yields |
$ 161.03 |
$ 159.95 |
$ 162.39 |
$ 141.38 |
$ 139.36 |
$ 141.73 |
|||||
|
Net Yields |
$ 304.41 |
$ 303.54 |
$ 301.58 |
$ 287.66 |
$ 285.39 |
$ 281.87 |
|||||
|
Adjusted Gross Margin per PCD |
$ 270.71 |
$ 269.94 |
$ 269.03 |
$ 260.40 |
$ 258.35 |
$ 255.22 |
|||||
|
ROYAL CARIBBEAN CRUISES LTD. |
|||||||||||
|
NON-GAAP RECONCILING INFORMATION |
|||||||||||
|
(unaudited) |
|||||||||||
|
Gross Cruise Costs, Net Cruise Costs and Net Cruise Costs excluding Fuel are calculated as follows (in millions, except APCD and costs per APCD. Certain |
|||||||||||
|
Quarter Ended September 30, |
Nine Months Ended September 30, |
||||||||||
|
2026 |
2026 On a |
2025 |
2026 |
2026 On a |
2025 |
||||||
|
Total cruise operating expenses |
$ 2,711 |
$ 2,715 |
$ 2,479 |
$ 7,506 |
$ 7,478 |
$ 6,841 |
|||||
|
Marketing, selling and administrative expenses |
519 |
519 |
522 |
1,615 |
1,604 |
1,593 |
|||||
|
Gross Cruise Costs |
3,231 |
3,234 |
3,001 |
9,121 |
9,083 |
8,434 |
|||||
|
Less: |
|||||||||||
|
Commissions, transportation and other |
735 |
735 |
696 |
1,921 |
1,909 |
1,823 |
|||||
|
Onboard and other |
338 |
338 |
312 |
838 |
837 |
775 |
|||||
|
Net Cruise Costs including other costs |
2,158 |
2,161 |
1,993 |
6,361 |
6,336 |
5,836 |
|||||
|
Less: |
|||||||||||
|
Restructuring charges and other initiative expenses (1) |
9 |
9 |
1 |
11 |
11 |
7 |
|||||
|
Net Cruise Costs |
2,149 |
2,152 |
1,992 |
6,350 |
6,325 |
5,829 |
|||||
|
Less: |
|||||||||||
|
Fuel |
347 |
347 |
297 |
966 |
967 |
854 |
|||||
|
Net Cruise Costs excluding Fuel |
$ 1,802 |
$ 1,805 |
$ 1,695 |
$ 5,383 |
$ 5,358 |
$ 4,976 |
|||||
|
APCD |
14,844,688 |
14,844,688 |
13,698,886 |
42,119,787 |
42,119,787 |
39,299,263 |
|||||
|
Gross Cruise Costs per APCD |
$ 217.64 |
$ 217.85 |
$ 219.09 |
$ 216.54 |
$ 215.64 |
$ 214.61 |
|||||
|
Net Cruise Costs per APCD |
$ 144.79 |
$ 144.96 |
$ 145.44 |
$ 150.76 |
$ 150.16 |
$ 148.33 |
|||||
|
Net Cruise Costs excluding Fuel per APCD |
$ 121.38 |
$ 121.56 |
$ 123.75 |
$ 127.81 |
$ 127.21 |
$ 126.61 |
|||||
|
(1) |
These amounts are included in Marketing, selling and administrative expenses within our consolidated statements of comprehensive income (loss). |
|
ROYAL CARIBBEAN CRUISES LTD. |
||||||||
|
NON-GAAP RECONCILING INFORMATION |
||||||||
|
(unaudited) |
||||||||
|
EBITDA, Adjusted EBITDA and Adjusted EBITDA Margin are calculated as follows (in millions, except APCD and per APCD data. Certain amounts may not |
||||||||
|
Quarter Ended September 30, |
Nine Months Ended September 30, |
|||||||
|
2026 |
2025 |
2026 |
2025 |
|||||
|
Net Income attributable to Royal Caribbean Cruises Ltd. |
$ 1,728 |
$ 1,575 |
$ 3,798 |
$ 3,514 |
||||
|
Interest income |
(5) |
(3) |
(15) |
(17) |
||||
|
Interest expense, net of interest capitalized |
291 |
248 |
805 |
725 |
||||
|
Depreciation and amortization expenses |
490 |
435 |
1,415 |
1,265 |
||||
|
Provision for income taxes |
27 |
34 |
66 |
67 |
||||
|
EBITDA |
2,531 |
2,289 |
6,069 |
5,553 |
||||
|
Other (income) expense |
(1) |
2 |
(10) |
(13) |
||||
|
Restructuring charges and other initiative expenses (1) |
9 |
1 |
11 |
7 |
||||
|
Equity investment impairment, (recovery) of losses and other |
— |
— |
— |
(1) |
||||
|
Adjusted EBITDA |
$ 2,539 |
$ 2,293 |
$ 6,071 |
$ 5,545 |
||||
|
Total revenues |
$ 5,591 |
$ 5,139 |
$ 14,876 |
$ 13,676 |
||||
|
APCD |
14,844,688 |
13,698,886 |
42,119,787 |
39,299,263 |
||||
|
Net Income attributable to Royal Caribbean Cruises Ltd. per APCD |
$ 116.44 |
$ 114.94 |
$ 90.18 |
$ 89.42 |
||||
|
Adjusted EBITDA per APCD |
$ 171.01 |
$ 167.35 |
$ 144.13 |
$ 141.09 |
||||
|
Adjusted EBITDA Margin |
45.4 % |
44.6 % |
40.8 % |
40.5 % |
||||
|
(1) |
These amounts are included in Marketing, selling and administrative expenses within our consolidated statements of comprehensive income (loss). |
|
ROYAL CARIBBEAN CRUISES LTD. |
|||||||
|
NON-GAAP RECONCILING INFORMATION |
|||||||
|
(unaudited) |
|||||||
|
Adjusted Net Income attributable to Royal Caribbean Cruises Ltd., and Adjusted Earnings per Share are calculated as follows (in millions, except per share data. Certain amounts may not add |
|||||||
|
Quarter Ended September 30, |
Nine Months Ended September 30, |
||||||
|
2026 |
2025 |
2026 |
2025 |
||||
|
Net Income attributable to Royal Caribbean Cruises Ltd. |
$ 1,728 |
$ 1,575 |
$ 3,798 |
$ 3,514 |
|||
|
Loss on extinguishment of debt and inducement expense (1) |
21 |
— |
50 |
10 |
|||
|
Restructuring charges and other initiative expenses (2) |
9 |
1 |
11 |
7 |
|||
|
Amortization of Silversea intangible assets resulting from the Silversea acquisition |
2 |
2 |
5 |
5 |
|||
|
Gain on sale of noncontrolling interest (3) |
— |
— |
— |
(11) |
|||
|
Equity investment impairment, (recovery) of losses and other |
— |
— |
— |
(1) |
|||
|
Adjusted Net Income attributable to Royal Caribbean Cruises Ltd. |
$ 1,760 |
$ 1,577 |
$ 3,865 |
$ 3,523 |
|||
|
Earnings per Share – Diluted (4) |
$ 6.45 |
$ 5.74 |
$ 14.12 |
$ 12.83 |
|||
|
Adjusted Earnings per Share – Diluted (5) |
$ 6.57 |
$ 5.75 |
$ 14.36 |
$ 12.83 |
|||
|
Weighted-Average Shares Outstanding – Diluted |
268 |
274 |
269 |
275 |
|||
|
(1) |
For 2026, includes the loss on extinguishment of debt associated with the February and August redemptions of debt. For 2025, includes $10 million of inducement expense related to the settlements of the 2025 6.00% convertible notes. These amounts are included in Interest expense, net of interest capitalized within our consolidated statements of comprehensive income (loss). |
|
(2) |
These amounts are included in Marketing, selling and administrative expenses within our consolidated statements of comprehensive income (loss). |
|
(3) |
For 2025, represents gain on sale of noncontrolling interest of Floating Docks and Grand Bahama Shipyard. These amounts are included in Other income (expense) within our consolidated statements of comprehensive income (loss). |
|
(4) |
For 2025, diluted EPS includes the add-back of dilutive inducement and interest expense related to our convertible notes of $16 million for the nine months ended September 30, 2025. |
|
(5) |
For 2025, Adjusted Diluted EPS includes the add-back of dilutive interest expense related to our convertible notes of $6 million for the nine months ended September 30, 2025. |
 View original content to download multimedia:https://www.prnewswire.co.uk/news-releases/royal-caribbean-group-reports-third-quarter-results-above-expectations-and-raises-full-year-guidance-302920592.html

27, Oct 2026
SBI Life launches ‘Waiver of Premium’ rider, ensuring continuity of policyholders’ long-term financial plans
New rider waives all future premiums upon occurrence of specified contingencies, helping customers maintain continuity of their life insurance plans
MUMBAI, India, Oct. 27, 2026 /PRNewswire/ — SBI Life Insurance, one of India’s most trusted private life insurers, launched ‘Waiver of Premium‘ rider, designed to ensure that policyholders’ long-term financial plans are not derailed by setbacks in life, such as a critical illness or disability.

Financial planning is inherently long term, with commitments often extending across several years. Whether it is planning for a child’s education, preparing for retirement, creating financial security for loved ones or meeting other important financial commitments, staying on track requires not only adequate protection but also the ability to sustain the financial commitment over time. An unforeseen event can impact one’s ability to meet premium commitments. SBI Life’s ‘Waiver of Premium’ rider addresses this need by waiving-off all future premiums (including extra premiums) upon the occurrence of specified contingencies covered under the rider, helping the base policy and other attached riders to continue as envisioned. Thus, families remain protected and long-term goals such as child’s education, retirement etc stay on course even when policyholder is unable to continue paying.
Available with select individual non-linked & linked life insurance products, the rider adds an additional layer of resilience to the financial commitment underlying a life insurance plan. Commenting on the launch, Mr. M. Anand, President & Chief Distribution Officer, SBI Life Insurance, said, “Financial security is not only about preparing for what lies ahead, but also about building resilience into future financial commitments. As customers plan across longer financial horizons, protection solutions need to address not just the risks they anticipate, but also the potential impact of unforeseen circumstances on their ability to sustain those plans. SBI Life’s Waiver of Premium rider is designed with this perspective, adding an important layer of continuity to long-term financial planning.” He further added, “At SBI Life, our endeavour is to make protection more relevant to the way customers approach financial planning today. The new rider reflects this approach by strengthening the resilience of life insurance plans against specified contingencies. By helping preserve continuity when circumstances change, the rider reinforces our commitment to enabling customers to approach their financial future with greater confidence and preparedness.”
Key features of ‘Waiver of Premium Riders’:
- Premium continuity: All future premiums (including extra premiums) are waived upon specified contingencies, helping the base policy and other attached riders to continue as per their terms.
- Specified Protection: The rider covers Accidental Total Permanent Disability (ATPD) and 21 specified critical illnesses when the proposer and life assured are the same.
- Protection for the proposer: The rider covers the proposer’s death, ATPD and 21 specified critical illnesses when the proposer and life assured are different.
- Flexible entry: Can be opted at inception or at a subsequent policy anniversary, subject to eligibility and a minimum outstanding premium payment term of five years.
With the launch of the ‘Waiver of Premium’ rider, SBI Life Insurance continues to strengthen its portfolio of customer-centric protection solutions that encourage disciplined financial planning and help individuals and families stay invested in their dreams, regardless of life’s uncertainties.
About SBI Life Insurance
SBI Life Insurance (‘SBI Life’ / ‘The Company’), one of the most trusted life insurance companies in India, was incorporated in October 2000 and is registered with the Insurance Regulatory and Development Authority of India (IRDAI) in March 2001.
Serving millions of families across India, SBI Life’s diverse range of products caters to individuals as well as group customers through Protection, Pension, Savings and Health solutions.
Driven by ‘Customer-First’ approach, SBI Life places great emphasis on maintaining world class operating efficiency and providing hassle-free claim settlement experience to its customers by following high ethical standards of service. Additionally, SBI Life is committed to enhance digital experiences for its customers, distributors and employees alike.
SBI Life strives to make insurance accessible to all, with its extensive presence across the country through its 1,241 offices, 29,055 employees, a large and productive network of about 2,93,443 agents, 81 corporate agents and 9 bancassurance partners with more than 40,000 partner branches, 161 brokers and other insurance marketing firms.
In addition to doing what’s right for the customers, the company is also committed to provide a healthy and flexible work environment for its employees to excel personally and professionally.
SBI Life strongly encourages a culture of giving back to the society and has made substantial contribution in the areas of child education, healthcare, disaster relief and environmental upgrade. In 2025-26, the Company touched over 20,500 direct beneficiaries through various CSR interventions.
Listed on the Bombay Stock Exchange (‘BSE’) and the National Stock Exchange (‘NSE’), the company has an authorized capital of ₹20.0 billion and a paid up capital of ₹10.0 billion. The AuM is ₹5,248.5 billion.
For more information, please visit our website- www.sbilife.co.in and connect with us on Facebook, Twitter, YouTube, Instagram, and LinkedIn.
(Numbers & data mentioned above are for the period ended June 30, 2026)
 View original content to download multimedia:https://www.prnewswire.com/in/news-releases/sbi-life-launches-waiver-of-premium-rider-ensuring-continuity-of-policyholders-long-term-financial-plans-302920625.html

27, Oct 2026
From Amazon to the ICC: Odisha’s Kajal Pradhan Turns Her Makeup Passion into a Global Opportunity
Berhampur, Oct 27: In a story of courage, determination and following one’s passion, Kajal Pradhan from Berhampur in Odisha has carved out a place for herself in the beauty industry after leaving her job at Amazon. Today, she is reported to be working as the official makeup artist for ICC men’s and women’s cricket events, marking a significant milestone in her professional journey.

Pradhan’s journey from the technology sector to the world of makeup artistry highlights how pursuing a passion can open doors to unexpected opportunities, even when the decision involves leaving behind a stable career.
From a Corporate Career to Makeup Artistry
Kajal previously worked at Amazon, but her growing interest in makeup and beauty eventually prompted her to take a different professional path. Leaving behind the security of a corporate job, she stepped into the competitive world of makeup artistry to pursue what she truly loved.
She began her journey as a freelance makeup artist in Pune before gradually building her professional network and establishing herself in Mumbai, a major centre for India’s entertainment and beauty industries.
Over time, she reportedly gained opportunities to work with celebrities and professionals from the film and television industries, helping her strengthen her portfolio and expand her presence in the field.
Overcoming Criticism and Challenges
The transition was not without difficulties. According to a social media post by X user Satya Nayak, Pradhan faced criticism and discouragement from people who questioned her decision to leave a stable technology job for a career in makeup.
However, she continued to work towards her goal, demonstrating persistence in an industry where building credibility, gaining clients and establishing professional connections can take considerable time.
Her reported association with International Cricket Council (ICC) men’s and women’s cricket events represents another important step in her career, taking her work beyond the conventional beauty and entertainment sectors.
Ambitions Beyond India
Pradhan is also reportedly looking to expand her professional horizons internationally, with aspirations to explore opportunities in Western markets. She is interested in using technology to develop her work and create more engaging experiences.
Despite her growing professional profile, she has maintained a connection with her home state, Odisha. According to Nayak’s post, she remains willing to support promotional initiatives related to the state and offer guidance to young women seeking advice on pursuing careers in makeup artistry.
An Inspiration for Aspiring Women
Kajal Pradhan’s journey offers an encouraging message for those who wish to pursue a career outside their conventional professional background. Her experience illustrates the importance of developing skills, gaining practical experience and staying committed to a chosen field despite criticism and uncertainty.
For aspiring makeup artists, particularly young women from smaller cities, her reported achievements demonstrate how talent, perseverance and professional growth can create opportunities in competitive industries.
Note: This story is based on the information provided in the original report, including claims attributed to a social media post by Satya Nayak. The details of Pradhan’s professional association with ICC events and other claims have not been independently verified.
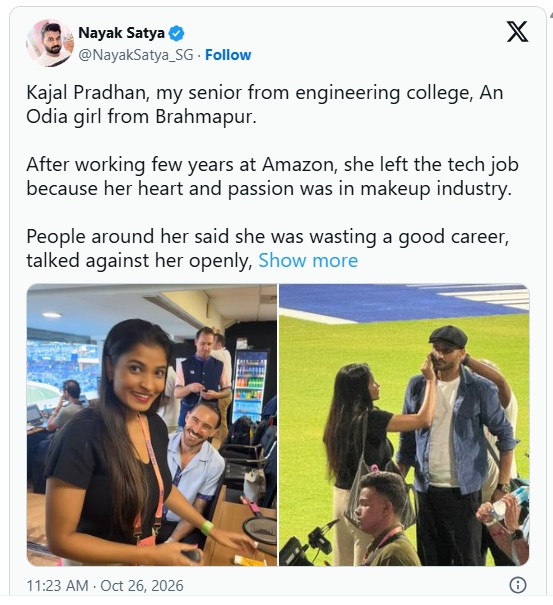
Kajal Pradhan, my senior from engineering college, An Odia girl from Brahmapur. After working few years at Amazon, she left the tech job because her heart and passion was in makeup industry. People around her said she was wasting a good career, talked against her openly, humiliated her many times before her big success. A girl from a small town shouldn’t leave a stable job for something like this. She heard it all and still started freelancing in Pune. Slowly she built her name in Mumbai. Worked with celebrities, film and TV people. Then came the big one , she became the official makeup artist for ICC men’s and women’s cricket events. From Brahmapur to those stages, standing with cricketers and stars. This is beyond a typical success. She was a lone girl holding a clear vision and a solid approach in a crowded industry full of big established names. She worked day and night, quietly, with no shortcuts, and still rose to shine on the biggest stages. With her pure talent, solid energy and determination from Odisha to international fame, she did it her way. Last week when we spoke, I could see how deeply passionate she is about this industry. She doesn’t just want to stay where she is. She is already looking beyond India targeting international forums and even the Western ecosystem. She wants to scale her passion properly, use technology, and make the whole thing more engaging and meaningful. Even after all that, she never says no when Odisha needs her. Any promotion, any young girl asking for guidance, she helps without thinking twice. Kajal didi, so proud of you. Keep going higher. Odisha needs more like you. Image copyright and credit- Kajal Pradhan ( her Instagram page muakajalpradhan)
— Nayak Satya (@NayakSatya_SG) October 26, 2026
27, Oct 2026
MEXC and Hacken Launch AI Trading Safety Handbook to Promote Safer AI Adoption
MUTSAMUDU, Comoros, Oct. 27, 2026 /PRNewswire/ — MEXC, a pioneer in 0-fee digital asset trading, and blockchain security, compliance, and regulatory assurance partner Hacken, have released the MEXC × Hacken AI Trading Safety Handbook, providing practical guidance on how users and platforms can use and deploy AI-assisted and automated trading tools more safely, from research and decision support through trade execution.

The handbook follows the recent MEXC AI Trading Report, which found strong interest in AI alongside clear demand for greater control. In MEXC’s 2026 survey, willingness to use automated trading rose from 55% to 71.8% when limits on funds, positions, leverage and losses were introduced.
As AI takes a more active role in trading, the handbook emphasizes that safety cannot rely on the AI model alone. AI-facilitated actions should be checked against separate permissions, financial limits and risk controls before execution. It covers risks including credential exposure, excessive permissions, manipulated data and unintended execution, while outlining practical safeguards for both users and platforms.
For users, the handbook sets out five safety checks: Ask, Verify, Limit, Control and Review. For platforms, it outlines five principles: Guard, Limit, Approve, Controls and Test. Together, they provide a practical framework for expanding the use of AI while keeping appropriate controls in place.
“AI can make trading more accessible and efficient, but greater capability should come with stronger safeguards,” said Vugar Usi Zade, CEO of MEXC. “At MEXC, we want users to benefit from innovation, while taking a measured approach to AI adoption. Our People First principle means giving users access to new capabilities without losing sight of control, transparency and risk.”
“AI agents will soon place more orders than people do. Trust in them should be earned the way smart contracts earned it: through independent controls, continuous red-teaming and evidence anyone can verify,” said Dyma Budorin, CEO and co-founder of Hacken. “This handbook is intended to raise awareness of those risks and provide practical support for both users and platforms. As adoption grows, platforms will need to test these safeguards continuously and strengthen them as new risks emerge.”
MEXC and Hacken hope the handbook can serve as a practical reference for users and platforms as AI becomes more deeply integrated into trading, helping raise risk awareness and support safer, more responsible adoption across the industry.
About MEXC
Founded in 2018, MEXC is a leading global multi-asset trading platform built as your 0-fee gateway to infinite opportunities. Serving users across 170+ markets, MEXC provides simple and efficient access to crypto, stocks, tokenized assets, derivatives, and a growing range of TradFi-linked opportunities through one account and one gateway.
With 0 trading fees, deep liquidity, broad asset coverage, and a high-performance trading experience, MEXC is designed for retail users who want to discover earlier, act faster, and trade with fewer barriers. As crypto and traditional finance continue to converge, MEXC is committed to making global opportunities more accessible, helping users trade freely and MEXCmize every opportunity.
MEXC Official Website| X | Telegram |How to Sign Up on MEXC
About Hacken
Hacken is a security and assurance partner for financial institutions and the infrastructure they rely on: exchanges, ecosystems, custodians, banks, asset managers, and tokenization platforms. Hacken’s AI security work includes AI agent security audits and red-teaming of AI systems.
Founded in 2017, Hacken has 60+ engineers and more than 1,500 clients across industries, including the European Commission, ADGM, Ethereum Foundation, Societe Generale-Forge, MetaMask, and Bybit.
Hacken website | X | LinkedIn

 View original content to download multimedia:https://www.prnewswire.co.uk/news-releases/mexc-and-hacken-launch-ai-trading-safety-handbook-to-promote-safer-ai-adoption-302920502.html

27, Oct 2026
EDC and EFA sign Memorandum of Understanding to deepen Canada-Australia trade and investment ties
Partnership between Canada and Australia’s export credit agencies opens opportunities for businesses in both countries
SYDNEY, Oct. 27, 2026 /PRNewswire/ — Export Development Canada (EDC) and Export Finance Australia (EFA) have signed a Memorandum of Understanding (MoU) to strengthen cooperation between the two organizations. The agreement establishes a framework for collaboration on strategic financing opportunities and investment projects that support economic growth, energy security, supply chain resilience and sustainable development.
Through the partnership, EDC and EFA will explore opportunities for co-financing, transaction facilitation, joint outreach and knowledge sharing, while helping connect Canadian and Australian companies and investors to pursue opportunities in areas of mutual interest.
Canada and Australia share a longstanding trade and investment relationship built on strong commercial ties and common economic interests. In 2025, bilateral merchandise trade between the two countries totalled CAD$7.3 billion, with Canadian exports exceeding CAD$3 billion. Since the Comprehensive and Progressive Agreement for Trans-Pacific Partnership (CPTPP) entered into force in 2018, bilateral merchandise trade has grown at an average annual rate of eight per cent.
Australia is the largest destination in the Asia-Pacific region for Canadian direct investment abroad, with Canadian direct investment in Australia reaching CAD$50.1 billion in 2025, while Australia’s direct investment in Canada totalled CAD$36.4 billion. Key areas of opportunity for Canadian and Australian companies include infrastructure, energy and energy transition, mining and critical minerals, agri-food and agtech, digital technologies, defence and aerospace.
Quotes
“Canada and Australia are trusted partners with a growing economic relationship that creates opportunities for workers and businesses in both countries. This past year, bilateral merchandise trade reached $7.3 billion, with Canadian exports exceeding $3 billion and two-way direct investment totalling more than $86 billion. This agreement between EDC and Export Finance Australia will help connect companies, attract investment and unlock opportunities in priority sectors that support long-term economic growth and resilience.”
The Honourable Maninder Sidhu, Canada’s Minister of International Trade
“Canada and Australia have built one of the strongest commercial relationships in the Asia-Pacific region, underpinned by significant two-way investment and complementary economic strengths. This agreement creates new opportunities for EDC and EFA to connect businesses, share expertise and support Canadian and Australian companies as they pursue growth opportunities abroad.”
Alison Nankivell, President and CEO, Export Development Canada
“This collaboration will deepen co-operation with an important likeminded partner, further strengthening our investment capabilities. We both have a shared interest in a secure and prosperous Indo-Pacific, and bringing our two export credit agencies closer together will create more opportunities for Aussie businesses and local jobs.”
Senator the Hon. Don Farrell, Minister for Trade and Tourism
“Australia and Canada have a shared interest in strengthening economic security and creating new opportunities across the Indo-Pacific, and the scale of investment required across infrastructure, critical minerals and the energy transition means collaboration between like-minded partners is increasingly important. This agreement gives EFA and EDC a practical framework to continue to work together, share expertise and explore opportunities where our combined capabilities can make a real difference to Australian and Canadian businesses.”
John Hopkins, Managing Director and CEO, Export Finance Australia
About Export Finance Australia
EFA is the Australian Government’s trade and strategic finance agency, backing Australian exporters, supply chains and overseas investment. EFA helps Australian businesses win work overseas, expand into new markets and participate in global supply chains. EFA also deploys finance to deliver national priorities that strengthen Australia’s economic security and regional partnerships. For more information visit www.exportfinance.gov.au.
About EDC
Export Development Canada (EDC) is a financial Crown corporation dedicated to helping Canadian businesses make an impact at home and abroad. EDC has the financial products and knowledge Canadian companies need to confidently enter new markets, reduce financial risk and grow their business as they go from local to global. Together, EDC and Canadian companies are building a more prosperous, stronger and sustainable economy for all Canadians. For more information and to learn how we can help your company, call us at 1-800-229-0575 or visit www.edc.ca.

27, Oct 2026
Healthware partners with Fujifilm to expand access to precision surgical imaging across India
- Collaboration combines Healthware’s pan-India market reach with Fujifilm’s advanced intra-operative and robotic ultrasound portfolio to empower clinical decision-making.
- Targeting corporate chains, government institutions, and specialized clinics, the partnership seeks to elevate real-time visualization in complex surgical workflows.
HYDERABAD, India, Oct. 27, 2026 /PRNewswire/ — In a significant development for India’s medical technology sector, Healthware, a premier provider of advanced medical devices, has announced a strategic collaboration with Fujifilm, a global leader in diagnostic and optical innovation. This alliance aims to scale up the availability of Fujifilm’s state-of-the-art intra-operative ultrasound systems across healthcare institutions nationwide, addressing critical clinical needs in complex surgical environments.

With 37 years of experience in establishing new medical technologies with focus on efficient patient care, Healthware brings an extensive pan-India network supported by dedicated service and clinical application teams. The partnership addresses a diverse healthcare ecosystem spanning government institutions, corporate hospital chains, large hospitals, individual practitioners, and specialized nursing homes and clinics.
Fujifilm’s advanced intra-operative ultrasound portfolio is engineered to transform real-time surgical visualization. Technological innovations integrate seamlessly into existing surgical workflows, enabling precise anatomical identification, accurate tumour boundary assessment, and confident intra-operative navigation.
Commenting on the strategic partnership, K. Tarun Narayan, Director, Healthware, said, “For 37 years, Healthware has been about one thing: bringing world-class medical technology to Indian clinicians and standing behind it every day. Partnering with Fujifilm, a name synonymous with imaging excellence, lets us bring real-time surgical ultrasound to more operating rooms across India, and that is a responsibility we take seriously.”
Echoing this sentiment, Koji Wada, Managing Director, Fujifilm India, said, “At Fujifilm, we believe that meaningful innovation is driven by collaboration and a shared commitment to improving patient care. Our partnership with Healthware marks an important step towards advancing surgical ultrasound solutions in India, bringing real-time imaging closer to the operating room. By combining technological innovation with clinical expertise, we aim to empower healthcare professionals with greater confidence in decision-making and contribute to better patient outcomes. Together, we aspire to make quality healthcare more accessible and create MORE SMILES across India.”
By integrating state-of-the-art surgical technologies into domestic healthcare infrastructure, this strategic alliance opens new business horizons for healthcare providers while reinforcing India’s growing stature as a premier global hub for medical tourism. Empowering clinicians with advanced, modern healthcare solutions directly translates to profound patient-centric benefits minimizing surgical risks, shortening recovery times, and driving sustainable growth within the nation’s healthcare economy.
For clinicians, the partnership brings Fujifilm’s real-time intra-operative ultrasound closer to the operating room across India, supporting precise anatomical identification, accurate tumour boundary assessment and confident intra-operative navigation, while integrating into existing surgical workflows. With Healthware’s pan-India network and its dedicated service and clinical application teams behind it, healthcare professionals gain greater confidence in decision-making. For patients, this means minimised surgical risk, shorter recovery times and better patient outcomes, helping make quality healthcare more accessible across the country.
For more information, please visit: www.healthwareindia.com
 View original content to download multimedia:https://www.prnewswire.com/in/news-releases/healthware-partners-with-fujifilm-to-expand-access-to-precision-surgical-imaging-across-india-302920561.html