


6, Nov 2026
Rotex Group Unveils Its New Brand Identity, Marking the Next Chapter in Its Engineering Journey
With the positioning ‘Empowering Flow Intelligence,’ the company builds on nearly six decades of engineering heritage to advance its vision for intelligent fluid control and customer-focused solutions.
MUMBAI, India, Nov. 6, 2026 /PRNewswire/ — Rotex Group, an engineering company with a legacy dating back to 1967, has unveiled its refreshed brand identity under the positioning ‘Empowering Flow Intelligence,’ marking a significant milestone in its evolution and future ambitions. Revealed at Rotex: The Next Chapter, an event held at The Leela Mumbai on October 31, 2026, the new brand identity reflects the company’s continued focus on precision engineering, application expertise and solutions designed around evolving industrial needs.
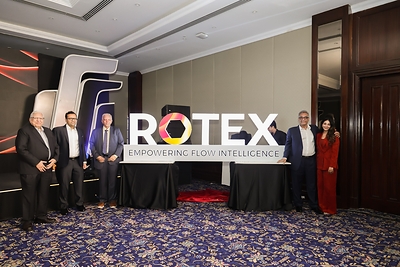
The brand evolution represents more than a visual refresh. It articulates Rotex’s ambition to strengthen its position as an engineering and solutions partner, bringing together its manufacturing heritage, fluid-control expertise and understanding of demanding industrial applications to address increasingly complex customer requirements.
Nearly six decades of engineering evolution
Founded in 1967, Rotex has evolved alongside changing industrial requirements and advances in automation. From its beginnings in textile machinery manufacturing to its entry into solenoid valves and fluid control, the company has continuously developed its engineering capabilities and expanded its presence across industries and markets.
Today, Rotex manufactures fluid control systems and related automation products for applications across industries including oil and gas, chemicals, pharmaceuticals, power and other process-driven sectors. The company also serves automotive applications through specialised engineering capabilities. Its journey has been shaped by manufacturing expansion, product development, international growth and the strengthening of quality and certification capabilities.
Commenting on the brand evolution, Nirav Shah, Director of Rotex Automation Limited said:
“Rotex’s journey since 1967 has been driven by engineering excellence and continuous evolution. With ‘Empowering Flow Intelligence’, we are building on this strong foundation to advance our capabilities, strengthen customer partnerships and address the evolving demands of industries across India and global markets.”
Empowering Flow Intelligence: A forward-looking brand philosophy
At the heart of the new positioning is a broader view of what effective flow control can enable. ‘Empowering Flow Intelligence’ brings together three central ideas: precision engineering, intelligent control and application expertise.
For Rotex, flow control goes beyond managing the movement of fluids or gases. It is about helping systems perform as intended, supporting operational reliability and addressing the specific demands of each application. The positioning reflects the company’s commitment to combining engineering knowledge and application understanding to deliver solutions aligned with customer needs.
Sharing the brand perspective, Mitali Shah, Director, Rotex Manufacturers and Engineers Pvt Ltd, said:
“Our new identity reflects more than a visual transformation; it represents the evolution of Rotex and our vision for the future. We want to build a more unified, contemporary brand that communicates our engineering strengths, customer commitment and ambition to create lasting value.”
One identity across industries and markets
Rotex serves customers across diverse industrial environments, spanning fluid control in process industries and specialised automotive applications. The refreshed identity creates a more cohesive expression of the company’s capabilities across these areas, reinforcing a shared commitment to engineering excellence and a consistent brand experience across customer and partner engagements.
The brand evolution also supports Rotex’s ambition to deepen relationships with customers and channel partners, strengthen its recognition in international markets and communicate its engineering expertise with greater clarity.
The unveiling brought together Rotex’s leadership, stakeholders and invited guests to celebrate the company’s engineering journey and mark the beginning of its next chapter.
As Rotex moves forward, its focus remains on building on its established capabilities, strengthening customer and partner relationships, and pursuing opportunities across domestic and international markets.
Nearly six decades of engineering. One future in flow.
With ‘Empowering Flow Intelligence,’ Rotex brings its engineering heritage and future ambitions together under a brand positioning designed to reflect the demands of today’s applications and the possibilities ahead.
About Rotex Group
Founded in 1967, Rotex Group manufactures fluid control systems and related automation products for industrial and specialised applications. With a presence in more than 83 countries, the company serves industries including oil and gas, chemicals, pharmaceuticals, power and automotive. Rotex combines engineering expertise, manufacturing capabilities and application knowledge to develop control solutions for demanding operating environments.
For more information, visit https://rotexautomation.com/
 View original content to download multimedia:https://www.prnewswire.com/in/news-releases/rotex-group-unveils-its-new-brand-identity-marking-the-next-chapter-in-its-engineering-journey-302931717.html

- 0
- By PRNewswire

6, Nov 2026
Multiliquid Treasury Launches 24/7 T-Bill Yield and Instant Settlement for Corporate Cash
Institutions can now earn continuous Treasury yields on idle operating balances with atomic, around-the-clock redemptions.
LOS ANGELES, Nov. 5, 2026 /PRNewswire/ — Multiliquid, the instant settlement layer for tokenized assets, today launched Multiliquid Treasury: an institutional cash management solution enabling corporate treasuries, fintechs, and asset managers to earn short-duration Treasury yields on idle capital, with instant redemption available 24/7.

Traditional corporate cash management forces a hard compromise between yield and velocity. Operating floats held for payroll, vendor obligations, and margin requirements routinely sit idle in non-interest-bearing operational accounts because money market funds can only be redeemed on business days, before strict daily cut-offs, and close completely over weekends and bank holidays.
Multiliquid Treasury eliminates this cash drag by using tokenized assets. Depositors access a formulaic interest rate tied directly to the 3-month U.S. Treasury Bill rate, while retaining the ability to sweep back into cash or stablecoins atomically in a single transaction, at 2:00 AM on a Sunday just as easily as midday Tuesday.
Solving the Weekend Float Problem
For an enterprise holding $25 million in liquid reserves, leaving cash idle costs hundreds of thousands of dollars annually in forgone interest. At an indicative annualized rate of up to 3.5%, that capital could generate up to approximately $875,000 a year in continuous yield without impairing same-day liquidity needs.
“For decades, corporate cash has had to choose between earning a return and being available, because the systems that move money close every evening and every weekend. On-chain settlement removes that constraint. Multiliquid Treasury is what cash management looks like in the new financial system: every idle dollar earns T-Bill yield, and every dollar is back in cash the moment you need it.” — Will Beeson, Founder and CEO, Multiliquid
How it works
- Diversified Money Market Fund Backing: Depositors lend to an SPV whose reserves are programmatically allocated across regulated, blue-chip tokenized government funds—including the WisdomTree Government Money Market Digital Fund (WTGXX) and the Janus Henderson Anemoy Treasury Fund (JTRSY), mitigating single-issuer concentration risk.
- Instant Exits via Dedicated Buffer. A programmatic 5–10% liquidity buffer, reinforced by institutional repo lines, supports atomic instant redemptions under normal market conditions, with no notice periods or redemption windows.
- Unified Onboarding: Replaces fragmented fund-by-fund documentation with a single KYB/KYC verification covering the entire underlying portfolio. U.S. and international accredited institutions can typically onboard within 24 hours.
- API-first. Accessible via institutional APIs and smart contracts for automated treasury sweeps, alongside a no-code dashboard for manual execution.
- Verifiable. Reserves and fund allocations are verifiable on-chain in real time, with core settlement contracts audited by Cantina and Zellic.
Availability
Multiliquid Treasury is live today across Ethereum Mainnet and Solana for eligible accredited and institutional investors. Onboarding at https://www.multiliquid.xyz/tsy-onboarding
Key facts
|
Item |
Detail |
|
Product |
Multiliquid Treasury |
|
Target Function |
Continuous T-Bill yield accrual with instant, 24/7 redemption |
|
Yield Benchmark |
Formulaic rate indexed to 3-month U.S. Treasury Bill yields (indicative APY up to 3.5%) |
|
Underlying |
WisdomTree WTGXX & Janus Henderson JTRSY (AAAf / S1+), buffered by 5–10% liquid cash reserves |
|
Settlement Mechanics |
Single-block atomic settlement (Ethereum Mainnet & Solana); 24/7/365 |
|
Legal Structure |
Depositors are lenders to Uniform Treasury SPV, LLC, a Delaware bankruptcy-remote SPV. |
|
Eligibility |
U.S. and international accredited & institutional investors; zero deposit minimums |
|
Onboarding |
KYC/KYB and accredited investor verification; typically under 24 hours |
|
Security Audits |
Cantina, Zellic |
|
Access Methods |
Developer API, Multiliquid Web Application, SDK, Direct via Smart Contracts |
About Multiliquid
Multiliquid is the instant settlement layer for tokenized assets: a neutral, institutional-grade liquidity layer that enables instant, 24/7 atomic settlement between tokenized assets, stablecoins and tokenized deposits. Treasurers, asset issuers and capital providers use Multiliquid to move between tokenized funds and cash without redemption windows or cut-off times. Learn more at multiliquid.xyz.
Media contact: team@multiliquid.xyz
 View original content to download multimedia:https://www.prnewswire.co.uk/news-releases/multiliquid-treasury-launches-247-t-bill-yield-and-instant-settlement-for-corporate-cash-302931092.html

6, Nov 2026
Quantinuum Reports Third Quarter 2026 Results and Raises Full-Year Revenue Outlook
- Third-Quarter Revenue Grew 233% Year-Over-Year; Raised FY2026 Revenue Outlook
- Extended Fault-Tolerance Industry Leadership with Back-to-Back World Records, Validating Most Credible Path to Universal, Fault-Tolerant Quantum Computing
- Announced Nexus Roadmap Through Apollo; Platform Adoption Grew Nearly 20% Quarter-Over-Quarter and Job Submissions Increased Tenfold Year-Over-Year for the 12 Months Ended August 2026
- Secured Largest Cloud Agreement in Company History, Including Multi-Year Committed Full-Stack Access Through Apollo
- Expanded Enterprise Reach Through Leading Hyperscaler Agreement and Oracle Beta Launch
BROOMFIELD, Colo., Nov. 5, 2026 /PRNewswire/ — Quantinuum Inc. (Nasdaq: QNT) (the “Company”), a leading full-stack quantum computing company, today announced financial results for the third quarter ended September 30, 2026.

“In the third-quarter, we extended our technology leadership in the critical area of fault-tolerance, added to our customer base, and expanded our routes to market,” said Rajeeb Hazra, President and Chief Executive Officer of Quantinuum. “This accelerated momentum is supporting our raised revenue outlook for 2026 and giving us more confidence than ever in the opportunity in front of us.”
Third Quarter 2026 Financial Highlights
- Revenue was $9.1 million, an increase of 233% year-over-year, compared with $2.7 million in the prior-year period.
- GAAP gross margin was 33.3%, compared with (43.5%) the prior-year period.
- Adjusted gross margin was 74.6%, up 853 basis points versus the prior-year period.
- Adjusted EBITDA loss was $80 million, compared with a loss of $45 million in the prior-year period.
- GAAP net loss was $118 million, compared with a net loss of $52 million in the prior-year period.
- GAAP net loss per share attributable to Class A common stockholders was $0.46.
- Adjusted net loss per share was $0.29.
- Cash & cash equivalents were $1.94 billion as of September 30, 2026.
Adjusted EBITDA, Adjusted Gross Margin and Adjusted net loss per share are non-GAAP financial measures defined under “Non-GAAP Financial Measures.” For a reconciliation of these non-GAAP financial measures to the most directly comparable GAAP financial measures, refer to the Appendix tables at the end of this press release.
Third Quarter and Recent Business Highlights
Commercial Highlights:
- Signed the largest cloud agreement in Company history, securing a multi-year extension with a leading global financial institution that includes committed access through Apollo and Nexus.
- Signed with another top 5 global pharmaceuticals company on applying quantum computing and AI to cancer-therapy materials that offer the potential to accelerate drug development and enable more effective treatments.
- Signed agreement with GE Vernova to advance application development in superconducting materials.
- Signed deal with Abu Dhabi Maritime Academy and Quincus for research and applications in maritime logistics.
- Expanded cloud distribution through a new agreement with a leading hyperscaler serving millions of developers and advanced Oracle partnership by launching a joint beta program for hybrid quantum-AI applications.
- Deepened U.S. government commitments by continuing to execute on DARPA QBI Stage B contract, actively discussing a Stage C scope of work, and participating in four winning proposals under Phase 1 of the Department of Energy’s Genesis Mission
- Advanced international deployments, with Helios assembly underway in Singapore ahead of spring 2027 commissioning and a Reimei system upgrade at RIKEN in Japan scheduled for completion this month.
Product Technology & Supply Chain:
- Validated the Company’s leading path to universal, fully fault-tolerant quantum computing by 2029 with back-to-back accuracy world records on Helios using two codes within the same scalable, end-to-end logical architecture. Reached 99.9995% logical fidelity in October—within Apollo’s target range—with an error rate ten times lower than September’s record and 100 times lower than the best published result across other hardware modalities. Results also demonstrate Quantinuum’s significant overhead and scalability advantage.
- Sol remains on track for 2H 2027, with full-scale control-system validation complete and integration and assembly targeted for Q1 2027, ahead of validation and tuning toward 100 logical qubits at a target logical error rate of 10⁻⁵.
- Apollo remains on track for 2029, supported by design milestones, including validating that our cryogenic system can be deployed at the required scale.
- Strengthened the manufacturing foundation for future systems through partnerships with GlobalFoundries, Infineon, Honeywell Aerospace and Monarch Quantum, and finalized the CHIPS R&D award as the only trapped-ion company selected.
Software:
- Announced a multi-generational Nexus roadmap through Apollo, aligning application development and hybrid deployment with successive hardware generations to build what the Company believes will be the first developer platform designed for the fault-tolerant era.
- Expanded fault-tolerant capabilities through a September Nexus release that extends Guppy tools for logical-qubit programming and supported error-correction encoding, reducing the need to rewrite applications for specific codes. Planned December release will expand responsive hybrid quantum-classical workflows, supported error-correction codes, and execution analytics for application optimization.
- Accelerated Nexus adoption and usage, with adoption growing nearly 20% quarter-over-quarter to 215 organizations; total job submissions increased tenfold in the 12 months through August 2026 compared with the preceding 12-month period.
Ecosystem:
- Introduced QUOPS with Sandia National Laboratories and NVIDIA, benchmarking useful computational scale and speed. Quantinuum is building industry-wide alignment toward a common standard that supports customer comparisons and purchasing decisions.
- Expanded the quantum user ecosystem, growing Q-Net to more than 800 members, adding eight startup partners and partnering with Singapore’s National Quantum Office to organize a global quantum challenge that attracted more than 200 submissions.
Financial Outlook
- Raising full-year 2026 revenue outlook to $31 to $34 million, up from $28 to $32 million previously.
Third Quarter 2026 Conference Call
Quantinuum will host a conference call at 5 PM Eastern time on Thursday, November 5, 2026, to discuss its results for the third quarter ended September 30, 2026, and provide a business update. The call will be available live via webcast here.
An archive replay of the webcast will be made available on the Quantinuum Investor Relations website following the call and will remain available for one year.
Non-GAAP Financial Measures
To supplement Quantinuum’s condensed consolidated financial statements presented in accordance with U.S. generally accepted accounting principles (“GAAP”), the Company uses the following non-GAAP financial measures presented in this release: Adjusted Gross Profit, Adjusted Gross Margin, Adjusted Net Loss, fully distributed, Adjusted EBITDA, and Adjusted Net Loss Per Share, fully distributed.
Adjusted Gross Profit starts with GAAP gross profit and adds back equity compensation and related employer taxes attributable to cost of revenue and depreciation and amortization attributable to cost of revenue.
Adjusted Gross Margin is calculated as Adjusted Gross Profit divided by revenue, net.
Adjusted Net Loss, fully distributed starts with GAAP net loss on an as-converted basis, adjusts for equity compensation and related employer taxes, costs of the initial public offering and the transition to public company reporting, severance expense, the change in fair value of liability-classified warrants, and loss on disposal and write down of assets, and then applies an assumed statutory tax rate to the resulting adjusted pre-tax loss. No tax benefit is recognized in respect of losses subject to a full valuation allowance, and accordingly no tax benefit is reflected in the periods presented.
Adjusted EBITDA starts with Adjusted Net Loss, fully distributed, and further excludes income tax expense, interest income, net, depreciation, and amortization of acquired intangibles.
Adjusted Net Loss Per Share, fully distributed is calculated as Adjusted Net Loss, fully distributed, divided by adjusted shares, fully distributed, basic and diluted, comprising weighted-average Class A common shares outstanding and Common Units of Quantinuum Holdings.
Management believes these measures provide investors with additional information useful in evaluating the Company’s operating performance and trends across periods. Quantinuum’s results include large non-cash charges that management does not consider indicative of ongoing operating performance, principally stock-based compensation recognized on completion of the Reorganization and remeasurement of liability-classified warrants. Both are driven by accounting triggers and external inputs rather than operating activity. As an early commercial-stage business, Quantinuum’s period-to-period results also are affected by the timing of individual contracts. Measures that isolate underlying operating performance from non-cash and transition items help investors assess trends across periods.
Quantinuum’s Up-C structure means that GAAP net loss attributable to Quantinuum Inc. reflects only the Class A share of the economics. Presenting adjusted results on an as-converted, fully distributed basis describes the whole economic enterprise, which is how management assesses performance and how the business is managed. Management uses these measures for internal planning and forecasting, evaluating operating performance, and preparing budgets.
These non-GAAP financial measures are supplemental and are not prepared in accordance with GAAP. They are not intended to be considered in isolation or as a substitute for the most directly comparable financial information prepared in accordance with GAAP. Quantinuum’s non-GAAP measures may differ from similarly titled measures used by other companies and, therefore, may not be comparable. Investors should review the reconciliations and should not rely on any single financial measure to evaluate the Company’s business.
Each non-GAAP financial measure is reconciled to its most directly comparable GAAP financial measure in the tables at the end of this release.
About Quantinuum
Quantinuum is a leading quantum computing company offering a full-stack platform designed to make quantum computing deployable in real-world environments. The company has commercially deployed multiple generations of trapped-ion based quantum systems built on the well-established QCCD architecture, which it has implemented with novel designs and capabilities to achieve the industry’s highest accuracy levels based on average two-qubit gate fidelity. Quantinuum has active engagements with market leaders across pharmaceuticals, material science, financial services, and government and industrial markets, as well as academic and research institutions globally.
The company has a global workforce of approximately over 850 employees, including top scientists and researchers. Over 70% of its technology team holds PhDs or Master’s degrees. Quantinuum’s headquarters is in Broomfield, Colorado, with additional facilities across the United States, United Kingdom, Germany, Japan, Qatar, and Singapore.
Availability of Information on Quantinuum’s Website
Investors and others should note that Quantinuum routinely announces material information to investors and the marketplace using SEC filings, press releases, public conference calls, webcasts, and the Quantinuum Investor Relations website. While not all of the information that the Company posts to the Quantinuum Investor Relations website is of a material nature, some information could be deemed to be material. Accordingly, the Company encourages investors, the media, and others interested in Quantinuum to review the information that it shares on ir.quantinuum.com.
Forward-Looking Statements
This press release contains forward-looking statements within the meaning of the Private Securities Litigation Reform Act of 1995. These statements are based on the current beliefs and expectations of Quantinuum’s management and are subject to significant risks and uncertainties. Actual results may differ materially from those described in the forward-looking statements. Any statements made in this press release that are not statements of historical fact, including statements about our beliefs, expectations and outlook are forward-looking statements. Forward-looking statements include information concerning possible or assumed future results of operations, including our guidance and descriptions of our business plans and strategies. These statements often include words such as “anticipate,” “expect,” “guidance,” “suggest,” “plan,” “believe,” “intend,” “estimate,” “target,” “project,” “should,” “could,” “would,” “may,” “will,” “forecast,” “outlook,” “potential,” “continues,” “seeks,” “predicts,” or the negatives of these words and other similar expressions.
Factors that could cause actual results to differ materially from those described in forward-looking statements include, but are not limited to: our ability to develop, commercialize and achieve market acceptance of our quantum computing hardware and software products; the pace of development of the quantum computing industry and the timing of commercial quantum advantage; our ability to attract and retain customers for our quantum computing systems and quantum computing as a service offerings; the risk of technological obsolescence or the emergence of competing quantum computing approaches, including superconducting, photonic, or other modalities; our dependence on key suppliers and manufacturers of specialized components, including those necessary for our trapped-ion quantum systems; our ability to scale production of our quantum computers and related systems; our ability to protect our intellectual property and proprietary technology; the significant research and development costs inherent in developing next-generation quantum computing capabilities; our ability to attract and retain highly skilled scientists, engineers and other personnel in a competitive labor market; changes in government funding, export controls, or regulations affecting quantum technologies; uncertainty regarding the timing and extent of commercial applications; cybersecurity risks and the protection of sensitive customer data; and macroeconomic conditions, geopolitical instability and their potential effects on our business and operations. For additional information on these and other risks that could affect the Company’s forward-looking statements, see the Company’s risk factors discussed in its filings with the U.S. Securities and Exchange Commission, including its most recent Quarterly Report on Form 10-Q, as such risk factors may be updated from time to time. You should evaluate all forward-looking statements made in this press release in the context of these risks and uncertainties. The Company disclaims any intent or obligation to update, revise or withdraw any forward-looking statement in this press release, except as required by applicable law or regulation.
Contacts
Investor & Media Contact
Shub Mukherjee – Investor Contact – investors@quantinuum.com
Aaron Sorenson – Media Contact – press@quantinuum.com
Appendix
|
Condensed Consolidated Statements of Operations (Unaudited) |
|||||
|
(dollars in thousands, except share and per share data) |
|||||
|
Amounts may not sum due to rounding. |
Three Months Ended September 30, |
Nine Months Ended September 30, |
|||
|
2026 |
2025 |
2026 |
2025 |
||
|
Revenue—net |
9,050 |
2,715 |
22,285 |
23,908 |
|
|
Costs and expenses: |
|||||
|
Cost of revenue |
3,194 |
1,058 |
14,618 |
3,728 |
|
|
Amortization expense |
4,184 |
2,839 |
12,554 |
8,517 |
|
|
Research and development expenses—net |
97,482 |
42,382 |
519,433 |
117,822 |
|
|
Sales and marketing expenses |
14,856 |
3,977 |
57,920 |
10,779 |
|
|
General and administrative expenses |
22,149 |
5,334 |
182,752 |
16,903 |
|
|
Total costs and expenses |
141,865 |
55,590 |
787,277 |
157,749 |
|
|
Loss from operations |
(132,815) |
(52,875) |
(764,992) |
(133,841) |
|
|
Interest income—net |
(14,324) |
(3,072) |
(23,807) |
(5,415) |
|
|
Loss on change in fair value of warrant |
— |
2,100 |
111,815 |
9,900 |
|
|
Other (income)/expense—net |
(283) |
3 |
(2,296) |
803 |
|
|
Loss before taxes |
(118,208) |
(51,906) |
(850,704) |
(139,129) |
|
|
Tax (benefit)/expense |
(357) |
130 |
260 |
313 |
|
|
Net loss |
(117,851) |
(52,036) |
(850,964) |
(139,442) |
|
|
Less: Net loss attributable to Quantinuum |
— |
N/A |
(246,680) |
N/A |
|
|
Less: Net loss attributable to the non- |
(100,899) |
N/A |
(521,914) |
N/A |
|
|
Net loss attributable to Quantinuum Inc. |
(16,952) |
N/A |
(82,370) |
N/A |
|
|
Net loss per share attributable to Class A |
(0.46) |
N/A |
(2.27) |
N/A |
|
|
Weighted-average shares used in computing net |
36,806,913 |
N/A |
36,216,440 |
N/A |
|
|
(1) For the nine months ended September 30, 2026, net loss per share of Class A common stock and weighted-average shares of Class A common stock are presented for the period during the Transactions through September 30, 2026, which is the period effective with and following the Transactions as defined in Note 1 — Description of Organization found in the June 30, 2026 form 10-Q. |
|||||
|
Condensed Consolidated Balance Sheets (Unaudited) |
||
|
(dollars in thousands) |
||
|
September 30, 2026 |
December 31, 2025 |
|
|
Assets |
||
|
Current assets: |
||
|
Cash and cash equivalents |
1,936,114 |
762,642 |
|
Accounts receivable |
3,254 |
5,068 |
|
Due from related parties |
336 |
604 |
|
Inventories |
8,057 |
— |
|
Net investment in lease, current |
5,773 |
5,773 |
|
Other current assets |
39,894 |
27,754 |
|
Total current assets |
1,993,428 |
801,841 |
|
Property and equipment—net |
162,598 |
120,965 |
|
Right-of-use assets |
30,171 |
10,000 |
|
Goodwill |
771,506 |
784,822 |
|
Other intangible assets—net |
101,027 |
114,282 |
|
Net investment in lease, non-current |
5,773 |
10,102 |
|
Other assets—net |
20,373 |
3,613 |
|
Total assets |
3,084,876 |
1,845,625 |
|
Liabilities |
||
|
Current liabilities: |
||
|
Accounts payable |
19,478 |
10,620 |
|
Due to related parties |
— |
1,273 |
|
Accrued liabilities |
60,475 |
44,358 |
|
Total current liabilities |
79,953 |
56,251 |
|
Warrant liability |
— |
38,400 |
|
License payable, non-current portion |
55,345 |
55,345 |
|
Operating lease liabilities, non-current |
29,137 |
7,143 |
|
Other liabilities |
605 |
893 |
|
Temporary equity |
||
|
Series A convertible redeemable preferred stock, $0.0001 par value per share; 31,983,034 |
— |
288,129 |
|
Series A-1 convertible redeemable preferred stock, $0.0001 par value per share; 28,016,966 |
— |
400,978 |
|
Series B convertible redeemable preferred stock, $0.0001 par value per share; 31,753,266 |
— |
824,834 |
|
Shareholders’ equity / Quantinuum (Cayman) equity |
||
|
Quantinuum (Cayman) equity |
— |
173,652 |
|
Preferred stock, $0.0001 par value per share; 20,000,000 shares authorized, as of September |
— |
— |
|
Class A common stock, $0.0001 par value per share; 2,000,000,000 shares authorized as of September |
4 |
— |
|
Class B common stock, $0.0001 par value per share; 2,000,000,000 shares authorized as of |
22 |
— |
|
Class A common stock held in treasury, at cost; 72,863 shares and 0 shares as of September |
(3,803) |
— |
|
Additional paid-in-capital |
541,704 |
— |
|
Accumulated other comprehensive (loss) income |
(1,466) |
— |
|
Accumulated deficit |
(82,370) |
— |
|
Total equity attributable to Quantinuum Inc. / Quantinuum (Cayman) |
454,091 |
173,652 |
|
Non-controlling interest |
2,465,745 |
— |
|
Total equity |
2,919,836 |
173,652 |
|
Total Liabilities and equity |
3,084,876 |
1,845,625 |
|
Condensed Consolidated Statements of Cash Flows (Unaudited) |
||
|
(dollars in thousands) |
||
|
Amounts may not sum due to rounding. |
Nine Months Ended September 30, |
|
|
2026 |
2025 |
|
|
Cash flows from operating activities: |
||
|
Net loss |
(850,964) |
(139,442) |
|
Adjustments to reconcile to net cash used for operating activities |
||
|
Depreciation and amortization |
27,868 |
22,442 |
|
Noncash lease expense |
4,510 |
1,799 |
|
Sales under sales-type lease |
— |
(16,526) |
|
Stock compensation expense |
484,699 |
— |
|
Loss on change in fair value of warrant liabilities |
111,815 |
9,900 |
|
(Gain)/Loss on disposal and write down of assets |
(4) |
909 |
|
Interest expense |
5 |
6 |
|
Foreign exchange (gain)/loss—net |
(118) |
(8) |
|
Access to quantum computing hardware |
6,889 |
4,746 |
|
Changes in operating assets and liabilities |
||
|
Accounts receivable |
1,804 |
1,769 |
|
Due from related parties |
224 |
424 |
|
Other current assets |
(20,836) |
(1,064) |
|
Net investment in leases |
4,330 |
4,330 |
|
Other assets—net |
(16,100) |
926 |
|
Accounts payable |
4,864 |
5,718 |
|
Due to related parties |
(1,126) |
76 |
|
Accrued liabilities |
12,481 |
7,052 |
|
Other liabilities |
(253) |
84 |
|
Net cash used for operating activities |
(229,912) |
(96,859) |
|
Cash flows from investing activities: |
||
|
Capital expenditures |
(64,705) |
(61,021) |
|
Net cash used for investing activities |
(64,705) |
(61,021) |
|
Cash flows from financing activities: |
||
|
Proceeds from the issuance of preferred stock to Honeywell |
— |
350,000 |
|
Proceeds from issuance of Series B Convertible Preferred Stock, net of issuance costs |
— |
251,103 |
|
Proceeds from issuance of common stock |
1,628,774 |
— |
|
Common stock issuance costs |
(28,844) |
— |
|
Other issuance Costs |
(814) |
|
|
Withholding taxes paid on stock compensation |
(130,780) |
— |
|
Net cash provided by financing activities |
1,468,336 |
601,103 |
|
Effect of exchange rate changes on cash and cash equivalents |
(247) |
1,589 |
|
Net increase in cash and cash equivalents |
1,173,472 |
444,812 |
|
Cash and cash equivalents at beginning of period |
762,642 |
172,343 |
|
Cash and cash equivalents at end of period |
1,936,114 |
617,155 |
|
Non-cash investing and financing activities: |
||
|
Unpaid purchases of property and equipment |
9,094 |
3,913 |
|
Unpaid other issuance costs |
1,774 |
7,263 |
|
Value of shares issued via cashless warrant exercise |
150,215 |
— |
|
Reconciliation of GAAP Gross Profit to Adjusted Gross Profit (Unaudited) |
|||||||
|
(dollars in thousands, except percentages) |
|||||||
|
Amounts may not sum due to rounding. |
Three Months Ended September 30, |
Nine Months Ended September 30, |
|||||
|
2026 |
2025 |
2026 |
2025 |
||||
|
Revenue, net |
9,050 |
2,715 |
22,285 |
23,908 |
|||
|
Cost of revenue |
3,194 |
1,058 |
14,618 |
3,728 |
|||
|
Amortization of acquired intangibles, cost of revenue portion¹ |
2,839 |
2,839 |
8,518 |
8,517 |
|||
|
GAAP gross profit |
3,017 |
(1,182) |
(851) |
11,663 |
|||
|
GAAP gross margin |
33.3 % |
(43.5 %) |
(3.8 %) |
48.8 % |
|||
|
Equity compensation and related employer taxes² |
748 |
— |
7,321 |
— |
|||
|
Depreciation and amortization³ |
2,985 |
2,975 |
10,024 |
9,553 |
|||
|
Adjusted gross profit |
6,750 |
1,793 |
16,494 |
21,216 |
|||
|
Adjusted gross margin |
74.6 % |
66.1 % |
74.0 % |
88.7 % |
|||
|
(1) Our condensed consolidated statements of operations present amortization of acquired intangibles as a single separate line and do not present a gross profit subtotal. The amount shown in this table is the portion of that line attributable to cost of revenue, allocated according to the assets to which it relates. Cost of revenue is presented as reported. The remaining portion is presented within research and development. (2) Represents stock-based compensation expense and the related employer payroll taxes on equity vesting, in each case attributable to cost of revenue. Employer payroll taxes were 2 and 244 for the three and nine months ended September 30, 2026, respectively, and 0 in the corresponding prior year periods. These amounts are a subset of the equity compensation and related employer taxes adjustment presented in the reconciliation of GAAP net loss. (3) Represents depreciation of property and equipment and amortization of acquired intangible assets attributable to cost of revenue. |
|||||||
|
Reconciliation of GAAP Net Loss to Adjusted Net Loss, Adjusted EBITDA and Adjusted Earnings Per Share (Unaudited) |
||||
|
(dollars in thousands, except share and per share amounts) |
||||
|
Amounts may not sum due to rounding. |
Three Months Ended September 30, |
Nine Months Ended September 30, |
||
|
2026 |
2025 |
2026 |
2025 |
|
|
Numerator |
||||
|
Net loss attributable to Quantinuum Inc. |
(16,952) |
N/A |
(82,370) |
N/A |
|
Net loss attributable to Quantinuum (Cayman) prior to the Transactions |
— |
N/A |
(246,680) |
N/A |
|
Net loss attributable to the non-controlling interest |
(100,899) |
N/A |
(521,914) |
N/A |
|
GAAP net loss, as-converted¹ |
(117,851) |
(52,036) |
(850,964) |
(139,442) |
|
Equity compensation and related employer taxes² |
37,333 |
— |
501,920 |
— |
|
IPO and public company readiness, legal and other transaction costs³ |
4,937 |
— |
24,738 |
— |
|
Severance expense |
353 |
— |
353 |
— |
|
Warrant fair value adjustment⁴ |
— |
2,100 |
111,815 |
9,900 |
|
Loss on disposal and write down of assets |
6 |
8 |
(4) |
909 |
|
Adjusted net loss, fully distributed |
(75,222) |
(49,928) |
(212,142) |
(128,633) |
|
Income tax (benefit) expense |
(357) |
130 |
260 |
313 |
|
Interest income, net |
(14,324) |
(3,072) |
(23,807) |
(5,415) |
|
Depreciation and other⁵ |
5,224 |
4,751 |
15,314 |
13,925 |
|
Amortization of acquired intangibles⁶ |
4,184 |
2,839 |
12,554 |
8,517 |
|
Adjusted EBITDA |
(80,495) |
(45,280) |
(207,821) |
(111,293) |
|
Denominator⁷ |
||||
|
Weighted-average Class A common shares outstanding, basic and diluted |
36,806,913 |
N/A |
36,216,440 |
N/A |
|
Common Units of Quantinuum Holdings |
225,242,666 |
N/A |
226,892,141 |
N/A |
|
Adjusted shares, fully distributed, basic and diluted |
262,049,579 |
N/A |
263,108,581 |
N/A |
|
Per share⁸ |
||||
|
GAAP net loss per Class A common share, basic and diluted |
(0.46) |
N/A |
(2.27) |
N/A |
|
Adjusted net loss per share, fully distributed, basic and diluted |
(0.29) |
n.m. |
(0.81) |
n.m. |
|
(1) The as-converted basis includes the economic interests represented by Class A common stock and Common Units of Quantinuum Holdings as if all Common Units were exchanged for Class A common stock. It is used because Class A common stock represents a minority of the economic interest in Quantinuum Holdings. (2) Represents non-cash compensation expense associated with equity-based awards, including expense recognized in connection with the Reorganization, together with the related employer payroll taxes on equity vesting. Employer payroll taxes were $94 and $17,221 for the three and nine months ended September 30, 2026, respectively, and zero in the corresponding prior year periods. The stock-based compensation component agrees to the stock compensation expense line in the condensed consolidated statements of cash flows. (3) Represents costs of the initial public offering, transaction costs, and the transition to public company reporting. These costs represent professional fees for advisory, legal, accounting, valuation and other professional or consulting services incurred related to the IPO. These costs are scoped by reference to their cause and have a defined end. They do not include the ongoing costs of operating as a public company. (4) Represents the non-cash change in fair value of liability-classified warrants, which is driven by valuation inputs and accounting remeasurement rather than operating activity. (5) Represents total depreciation and amortization per our condensed consolidated statements of cash flows, less amortization of acquired intangibles shown separately below. Includes amortization of capitalized software. (6) Represents total amortization of acquired intangible assets for the period and agrees to the amortization expense line in the condensed consolidated statements of operations. (7) The denominator comprises Class A common stock and all Common Units of Quantinuum Holdings. Class B common stock is non-economic, carries voting rights only, and is cancelled upon exchange of the corresponding Common Units. (8) GAAP net loss per Class A common share covers only the period from June 5, 2026, following the Transactions, while adjusted net loss per share, fully distributed, covers the full nine month period presented. The two measures therefore are not calculated on the same period basis. No per share amounts are presented for periods prior to the Reorganization because the calculation would not produce values meaningful to users.
|
||||
 View original content to download multimedia:https://www.prnewswire.co.uk/news-releases/quantinuum-reports-third-quarter-2026-results-and-raises-full-year-revenue-outlook-302931318.html

6, Nov 2026
Global solidarity delivers major boost to Education Cannot Wait as “Hope Starts Here” campaign approaches its US$600 million goal
Governments announce US$ 405.8 million in new pledges at Geneva replenishment conference, bringing ECW to 90% of its funding target and opening new pathways for innovative partnerships to support education for crisis-affected children.
GENEVA, Nov. 6, 2026 /PRNewswire/ — Governments and partners rallied behind the world’s most vulnerable children today, announcing US$405.8 million in new pledges to Education Cannot Wait (ECW) at its High-Level Replenishment Conference, hosted by Switzerland in Geneva. Together with US$135.8 million in financial resources already secured through previous multi-year donor commitments, these pledges bring ECW’s Hope Starts Here campaign total to US$541.6 million, reaching 90% of its US$600 million target.
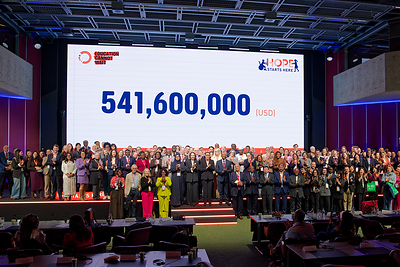
ECW expressed its deep gratitude to all governments and partners that stepped forward with financial commitments, reaffirming their solidarity with children affected by conflict, displacement and climate-related disasters at a time of growing humanitarian needs and shrinking international aid budgets.
Germany, the United Kingdom, Norway, Canada, Switzerland, Ireland, EU, and Japan were among the governments whose commitments demonstrated continued international leadership and confidence in ECW’s mission. Their collective support sends a powerful message: even in difficult times, the world cannot afford to turn its back on children’s education.
The conference marked a defining moment in ECW’s tenth anniversary year, renewing the commitment made when the Fund was established in 2016: that children living through crises must not be left behind.
Sigrid Kaag, Chair of ECW’s High-Level Steering Group, said: “Education is a fundamental human right, even in times of conflict, displacement and disaster. Today’s commitments are a powerful demonstration of international solidarity and a renewal of the promise we made ten years ago: that children caught in crises will not be left behind. That promise must now be translated into action.”
Switzerland’s leadership in hosting the conference reinforced the importance of collective responsibility and sustained international cooperation to protect children’s right to education.
Ambassador Dominik Stillhart, Co-Chair of ECW’s Executive Committee, said: “For more than a century, Geneva has been where the world comes together to address its toughest challenges, and one lesson stands out: education cannot be treated as an exception when crises strike. That is why Switzerland hosted this conference and pledged CHF 35 million to Education Cannot Wait for 2027 to 2030. But no country can do this alone. We need governments and partners to step up. Today, our partners chose to keep that promise funded.”
Since its establishment, ECW and its partners have reached more than 16 million children in crisis-affected countries. Yet the scale of the challenge continues to grow, with an estimated 258 million school-aged children and adolescents affected by crises worldwide.
The commitments announced in Geneva provide a strong foundation for ECW’s 2027–2030 Strategic Plan, which aims to reach 10 million children, half of them girls and including one million children with disabilities. The new strategy will strengthen ECW’s ability to respond rapidly to emergencies while providing more sustained support in protracted crises, investing in quality learning, protection, inclusion and the resilience of national education systems.
The conference also signalled growing momentum to explore new approaches to financing education in emergencies. Partnership offers and initiatives involving Porticus, the International Finance Facility for Education (IFFEd), the Education Bridging Fund (EBF) and Swiss cantonal banks highlighted opportunities to complement traditional donor contributions by mobilizing development finance and private capital.
Discussions involving Enosis Capital, BNP Paribas and MetLife Investment Management also explored the potential of an education continuity outcome bond, currently under development, to mobilize investment for children affected by crises. These initiatives, at different stages of development and subject to further design and institutional approvals, could help ECW diversify its financing base and unlock additional resources in the years ahead.
Beyond financing, high-level discussions brought together governments and partners from crisis-affected countries to demonstrate the importance of national leadership, including the integration of refugee and displaced children into national education systems and the need for more predictable financing that connects humanitarian response with longer-term recovery.
For ECW, the Geneva conference represents a major milestone, but not the conclusion of the Hope Starts Here campaign. Building on the confidence and commitments demonstrated by partners, the Fund will now focus on translating this momentum into results for children.
Maysa Jalbout, Director of Education Cannot Wait, said: “Today, our partners have given us more than financial commitments. They have placed their confidence in ECW and entrusted us with an enormous responsibility. We are deeply grateful. But the true measure of today’s success will not be how much we have raised. It will be the difference we make in children’s lives. Our work starts now.”
Looking ahead, ECW will focus on three priorities at the heart of its next strategic period.
First, ensuring that children are learning. Access to education remains essential, but it is not enough. ECW will place greater emphasis on quality learning, alongside children’s safety, mental health and well-being, ensuring that investments deliver meaningful and measurable results.
Second, strengthening national and local leadership. ECW will work to bring decisions and resources closer to communities affected by crises, advancing its ambition to channel at least 50% of programme financing through national and local partners by 2030.
Third, broadening the coalition that finances education in emergencies. Government contributions will remain the backbone of ECW’s work, complemented by stronger partnerships with philanthropy, businesses, development banks and investors to mobilize additional and more predictable financing.
With the replenishment target now within reach, ECW will continue engaging existing and prospective partners to close the remaining funding gap and build on the momentum generated in Geneva.
Ten years after its creation, ECW enters its next chapter with renewed confidence, an ambitious strategy and a strengthened coalition of partners united by a common commitment: no child should have to wait for a crisis to end before they can learn.
Notes to Editors
About Education Cannot Wait:
Education Cannot Wait (ECW) is the global fund for education in crises. The Fund provides rapid, flexible funding to locally-led education responses that protect learning for refugee, internally displaced and other children, while strengthening systems to sustain learning and resilience in fragile and conflict-affected contexts. ECW works with governments, public and private funders, UN agencies, civil society organisations, and other humanitarian and development aid actors so that no child is left behind.
As global crises intensify and the education financing gap widens, ECW calls on public and private sector partners to scale up investments so millions more crisis-affected girls and boys can learn and rebuild their futures.
Additional information available at: www.educationcannotwait.org
For press inquiries:
Rafik Elouerchefani: ecwcomms@un-ecw.org

 View original content to download multimedia:https://www.prnewswire.co.uk/news-releases/global-solidarity-delivers-major-boost-to-education-cannot-wait-as-hope-starts-here-campaign-approaches-its-us600-million-goal-302931588.html

6, Nov 2026
Cosmetic Dental Care: The Science of a Beautiful Smile and Better Oral Confidence
A smile is one of the most powerful forms of personal expression. It communicates confidence, warmth and personality without requiring words. However, stained teeth, uneven alignment, chipped enamel or gaps can sometimes make people conscious of their appearance. With the development of modern dental science, cosmetic dental care is offering new ways to address these concerns through personalised treatments that combine aesthetics with oral health.
Cosmetic dentistry is no longer limited to celebrities or people seeking dramatic smile transformations. Increasing awareness of dental aesthetics, professional grooming and preventive healthcare has encouraged people from different age groups to explore treatments that improve the appearance of their teeth.
Today, cosmetic dental care covers a wide range of procedures, from simple teeth whitening to advanced smile correction and restorative treatments. The objective is not merely to create perfectly white teeth but to achieve a natural-looking smile that complements an individual’s facial features and dental structure.
What Makes Cosmetic Dental Care Important?
The appearance of teeth can influence how people feel about themselves. Discoloured, damaged or poorly aligned teeth may affect confidence, particularly during conversations, photographs and professional interactions.
Cosmetic dental care addresses these concerns through procedures designed to improve tooth colour, shape, position and overall smile appearance.
Unlike a one-size-fits-all approach, modern cosmetic dentistry focuses on individual requirements. A dentist considers several factors, including tooth structure, gum health, facial proportions, bite alignment and the patient’s expectations before recommending treatment.
Another important consideration is maintaining the natural strength of teeth. Aesthetic improvements should be planned carefully to avoid unnecessary removal of healthy tooth structure or procedures that could create long-term dental complications.
Cosmetic Dental Treatments Transforming Modern Dentistry
The availability of different treatment options allows dentists to address a variety of aesthetic concerns. Some of the most commonly used procedures include:
1. Teeth Whitening for a Brighter Smile
Tooth discolouration is a common concern. Regular consumption of tea, coffee, certain foods and tobacco, along with ageing, can gradually affect the natural colour of teeth.
Professional teeth whitening uses dentist-supervised bleaching treatments to reduce stains and improve tooth brightness. Depending on the condition of the teeth, treatment may be performed at a dental clinic or through prescribed home-whitening systems.
However, whitening is not suitable for every type of discolouration. Patients with sensitive teeth, untreated cavities or gum problems should undergo a dental assessment before proceeding.
2. Dental Veneers for Smile Enhancement
Dental veneers are thin, customised coverings attached to the front surfaces of teeth. They are used to improve the appearance of teeth affected by persistent discolouration, minor chips, irregular shapes or small gaps.
Porcelain and composite resin are commonly used materials. Porcelain veneers offer a natural appearance and good stain resistance, while composite veneers may provide a comparatively conservative and affordable alternative in suitable cases.
Since conventional veneer placement can involve permanent enamel removal, patients should carefully discuss the advantages, limitations and alternatives with their dentist.
3. Dental Bonding to Repair Minor Imperfections
Small chips, uneven edges and minor gaps do not always require extensive dental procedures. Dental bonding provides a relatively simple solution for certain cosmetic imperfections.
In this treatment, a tooth-coloured composite resin is applied to the affected area, shaped to match the natural tooth and hardened using a special curing light.
The procedure is generally less invasive than conventional veneers and can often be completed in one appointment. Nevertheless, bonding materials may require polishing, repair or replacement over time.
4. Clear Aligners and Modern Teeth Straightening
Tooth alignment plays an important role in the overall appearance of a smile. Crowded, rotated or widely spaced teeth can affect dental aesthetics and, in some cases, oral hygiene.
Clear aligners have introduced a discreet alternative to conventional braces for patients with suitable orthodontic conditions.
These transparent, removable trays gradually move teeth into planned positions. Patients typically progress through a series of aligners under professional supervision.
Treatment success depends on the complexity of the dental problem and consistent use of the aligners as prescribed.
5. Dental Crowns for Damaged Teeth
A damaged or weakened tooth may require more than a cosmetic correction. Dental crowns provide coverage and protection while restoring the tooth’s shape, appearance and function.
Depending on the clinical situation, crowns can be manufactured using ceramic, porcelain-fused-to-metal or other restorative materials.
They are particularly useful when a tooth has extensive damage or has undergone significant restoration. The dentist determines the appropriate material based on strength, appearance and functional requirements.
Digital Technology Is Changing the Smile Makeover Experience
One of the biggest developments in modern cosmetic dentistry is the integration of digital technology into treatment planning.
Digital smile design allows dentists to study facial proportions, tooth dimensions and smile characteristics before recommending aesthetic changes. Intraoral scanners can capture digital impressions, while computer-aided design and manufacturing technologies support the production of customised dental restorations.
These developments offer several advantages:
-
Greater precision in dental measurements and treatment planning.
-
Better communication between dentists and patients.
-
Improved customisation of veneers, crowns and other restorations.
-
More efficient clinical workflows.
-
Better visualisation of potential treatment outcomes.
Nevertheless, digital simulations represent planned possibilities rather than guaranteed final results. Clinical judgement and the patient’s actual dental condition remain central to treatment decisions.
Cosmetic Dentistry and the Psychology of Confidence
The benefits of an attractive smile are not restricted to physical appearance. For some individuals, improving dental aesthetics can help reduce self-consciousness and encourage more comfortable social interaction.
People who previously avoided smiling in photographs or felt uncomfortable speaking in public may experience a positive change after addressing their dental concerns.
However, cosmetic dentistry should not be viewed as a requirement for confidence or personal acceptance. Natural teeth come in different shapes, shades and arrangements. The purpose of treatment should be to address individual concerns rather than pursue unrealistic standards of perfection.
How to Choose the Right Cosmetic Dental Procedure
Choosing a cosmetic treatment requires professional guidance. A procedure that works well for one person may not be appropriate for another.
Before starting treatment, patients should consider the following:
Understand the underlying problem: Tooth discolouration, enamel damage, alignment issues and gum conditions require different approaches.
Prioritise oral health: Existing cavities, infections and gum disease should be treated before elective cosmetic procedures.
Discuss treatment alternatives: Ask the dentist whether a less invasive option can achieve the desired result.
Evaluate long-term costs: Some procedures require periodic maintenance, repairs or replacement.
Check professional credentials: Select a qualified dentist with relevant clinical experience in the proposed procedure.
Set realistic expectations: Understand the likely results, limitations, recovery requirements and possible complications.
Patients should also ask how much natural tooth structure will be affected and whether the proposed procedure can be reversed.
The Business and Growth Potential of Cosmetic Dentistry
The increasing interest in dental aesthetics is creating opportunities for specialised dental practices, dental laboratories and manufacturers of oral healthcare products.
Cosmetic dental services are becoming an important part of the modern dental clinic business model. Practices are investing in digital scanners, advanced imaging systems, restorative materials and patient consultation facilities to improve treatment delivery.
The segment also creates opportunities for dental technology companies developing aligner systems, dental ceramics, digital design software and specialised equipment.
For dental clinics, long-term success will depend on more than attractive treatment packages. Clinical expertise, patient education, transparent pricing, ethical recommendations and consistent treatment quality will remain essential factors in building trust.
Maintaining Your Smile After Cosmetic Treatment
Cosmetic dental procedures require proper aftercare to maintain their results. Even the most advanced treatments cannot replace regular oral hygiene.
Patients should follow a consistent dental care routine that includes:
-
Brushing twice daily with fluoride toothpaste.
-
Cleaning between teeth through flossing or interdental brushes.
-
Limiting excessive consumption of staining foods and beverages.
-
Avoiding tobacco products.
-
Attending regular dental check-ups.
-
Avoiding biting hard objects or using teeth to open packages.
-
Following dentist-specific maintenance instructions.
People who grind their teeth may also need a professionally recommended night guard to protect dental restorations.
The Future of Cosmetic Dental Care
The future of cosmetic dentistry is expected to focus increasingly on minimally invasive procedures, personalised treatment planning and advanced restorative materials.
Digital imaging, artificial intelligence-assisted analysis and improved scanning technologies are making it easier for dentists to evaluate dental conditions and communicate treatment options. At the same time, developments in ceramic materials and composite resins are expanding possibilities for natural-looking restorations.
There is also a growing emphasis on preserving natural teeth rather than recommending extensive cosmetic alterations. This approach reflects a broader shift towards responsible dentistry, where aesthetic improvements must be balanced with long-term oral health.
Conclusion
Cosmetic dental care has developed into a specialised area of modern dentistry that combines science, technology and aesthetics. From whitening stained teeth and repairing minor imperfections to correcting alignment and restoring damaged teeth, available treatments provide several ways to improve the appearance of a smile.
However, the real value of cosmetic dentistry lies in achieving results that are appropriate, healthy and sustainable. Professional consultation, informed decisions and regular dental care are essential to achieving this balance.
A beautiful smile does not need to be perfect. It needs to be healthy, natural and one that allows an individual to smile with confidence.
6, Nov 2026
Global solidarity delivers major boost to Education Cannot Wait as “Hope Starts Here” campaign approaches its US$600 million goal
Governments announce US$ 405.8 million in new pledges at Geneva replenishment conference, bringing ECW to 90% of its funding target and opening new pathways for innovative partnerships to support education for crisis-affected children.
GENEVA, Nov. 6, 2026 /PRNewswire/ — Governments and partners rallied behind the world’s most vulnerable children today, announcing US$405.8 million in new pledges to Education Cannot Wait (ECW) at its High-Level Replenishment Conference, hosted by Switzerland in Geneva. Together with US$135.8 million in financial resources already secured through previous multi-year donor commitments, these pledges bring ECW’s Hope Starts Here campaign total to US$541.6 million, reaching 90% of its US$600 million target.
ECW expressed its deep gratitude to all governments and partners that stepped forward with financial commitments, reaffirming their solidarity with children affected by conflict, displacement and climate-related disasters at a time of growing humanitarian needs and shrinking international aid budgets.
Germany, the United Kingdom, Norway, Canada, Switzerland, Ireland, EU, and Japan were among the governments whose commitments demonstrated continued international leadership and confidence in ECW’s mission. Their collective support sends a powerful message: even in difficult times, the world cannot afford to turn its back on children’s education.
The conference marked a defining moment in ECW’s tenth anniversary year, renewing the commitment made when the Fund was established in 2016: that children living through crises must not be left behind.
Sigrid Kaag, Chair of ECW’s High-Level Steering Group, said: “Education is a fundamental human right, even in times of conflict, displacement and disaster. Today’s commitments are a powerful demonstration of international solidarity and a renewal of the promise we made ten years ago: that children caught in crises will not be left behind. That promise must now be translated into action.”
Switzerland’s leadership in hosting the conference reinforced the importance of collective responsibility and sustained international cooperation to protect children’s right to education.
Ambassador Dominik Stillhart, Co-Chair of ECW’s Executive Committee, said: “For more than a century, Geneva has been where the world comes together to address its toughest challenges, and one lesson stands out: education cannot be treated as an exception when crises strike. That is why Switzerland hosted this conference and pledged CHF 35 million to Education Cannot Wait for 2027 to 2030. But no country can do this alone. We need governments and partners to step up. Today, our partners chose to keep that promise funded.”
Since its establishment, ECW and its partners have reached more than 16 million children in crisis-affected countries. Yet the scale of the challenge continues to grow, with an estimated 258 million school-aged children and adolescents affected by crises worldwide.
The commitments announced in Geneva provide a strong foundation for ECW’s 2027–2030 Strategic Plan, which aims to reach 10 million children, half of them girls and including one million children with disabilities. The new strategy will strengthen ECW’s ability to respond rapidly to emergencies while providing more sustained support in protracted crises, investing in quality learning, protection, inclusion and the resilience of national education systems.
The conference also signalled growing momentum to explore new approaches to financing education in emergencies. Partnership offers and initiatives involving Porticus, the International Finance Facility for Education (IFFEd), the Education Bridging Fund (EBF) and Swiss cantonal banks highlighted opportunities to complement traditional donor contributions by mobilizing development finance and private capital.
Discussions involving Enosis Capital, BNP Paribas and MetLife Investment Management also explored the potential of an education continuity outcome bond, currently under development, to mobilize investment for children affected by crises. These initiatives, at different stages of development and subject to further design and institutional approvals, could help ECW diversify its financing base and unlock additional resources in the years ahead.
Beyond financing, high-level discussions brought together governments and partners from crisis-affected countries to demonstrate the importance of national leadership, including the integration of refugee and displaced children into national education systems and the need for more predictable financing that connects humanitarian response with longer-term recovery.
For ECW, the Geneva conference represents a major milestone, but not the conclusion of the Hope Starts Here campaign. Building on the confidence and commitments demonstrated by partners, the Fund will now focus on translating this momentum into results for children.
Maysa Jalbout, Director of Education Cannot Wait, said: “Today, our partners have given us more than financial commitments. They have placed their confidence in ECW and entrusted us with an enormous responsibility. We are deeply grateful. But the true measure of today’s success will not be how much we have raised. It will be the difference we make in children’s lives. Our work starts now.”
Looking ahead, ECW will focus on three priorities at the heart of its next strategic period.
First, ensuring that children are learning. Access to education remains essential, but it is not enough. ECW will place greater emphasis on quality learning, alongside children’s safety, mental health and well-being, ensuring that investments deliver meaningful and measurable results.
Second, strengthening national and local leadership. ECW will work to bring decisions and resources closer to communities affected by crises, advancing its ambition to channel at least 50% of programme financing through national and local partners by 2030.
Third, broadening the coalition that finances education in emergencies. Government contributions will remain the backbone of ECW’s work, complemented by stronger partnerships with philanthropy, businesses, development banks and investors to mobilize additional and more predictable financing.
With the replenishment target now within reach, ECW will continue engaging existing and prospective partners to close the remaining funding gap and build on the momentum generated in Geneva.
Ten years after its creation, ECW enters its next chapter with renewed confidence, an ambitious strategy and a strengthened coalition of partners united by a common commitment: no child should have to wait for a crisis to end before they can learn.
Notes to Editors
About Education Cannot Wait:
Education Cannot Wait (ECW) is the global fund for education in crises. The Fund provides rapid, flexible funding to locally-led education responses that protect learning for refugee, internally displaced and other children, while strengthening systems to sustain learning and resilience in fragile and conflict-affected contexts. ECW works with governments, public and private funders, UN agencies, civil society organisations, and other humanitarian and development aid actors so that no child is left behind.
As global crises intensify and the education financing gap widens, ECW calls on public and private sector partners to scale up investments so millions more crisis-affected girls and boys can learn and rebuild their futures.
Additional information available at: www.educationcannotwait.org
For press inquiries:
Rafik Elouerchefani: ecwcomms@un-ecw.org
View original content to download multimedia:https://www.prnewswire.co.uk/news-releases/global-solidarity-delivers-major-boost-to-education-cannot-wait-as-hope-starts-here-campaign-approaches-its-us600-million-goal-302931588.html
6, Nov 2026
Odisha-Japan Relations to Get Boost as Tottori Governor Shinji Hirai Visits November 10
Bhubaneswar, Nov 6 (UDN): Odisha is preparing to strengthen its international partnerships as a high-level Japanese delegation led by Tottori Prefecture Governor Shinji Hirai is scheduled to visit the state from November 10 to 12. The three-day visit is expected to open new avenues for Japanese investment, industrial cooperation, skill development, education and cultural exchange.

Representational Image
A major highlight of the visit will be the proposed signing of a Friendship Agreement between the Odisha Government and the Tottori Prefectural Government. The agreement is expected to establish a long-term framework for cooperation in economic activities, tourism, environmental initiatives and exchanges involving students, youth and professionals.
The visit is being viewed as an important opportunity to deepen Odisha’s engagement with Japan and explore partnerships that could translate into investment opportunities and employment prospects for the state.
Japanese delegation to interact with Odisha’s startup and business community
The visiting delegation will begin its official engagements on November 10 with an interaction involving Odisha’s startup ecosystem and business community at Startup Odisha’s O-Hub in Bhubaneswar.
The programme will also include a visit to the Central Tool Room and Training Centre (CTTC), followed by a business roundtable bringing together state government officials, industry representatives, Japanese companies operating in Odisha and business delegates from Tottori.
Discussions are expected to explore investment possibilities and business partnerships across sectors such as manufacturing, food processing, technology and other emerging industries.
The interactions are expected to provide Japanese businesses with an opportunity to understand Odisha’s industrial ecosystem and identify potential areas for collaboration.
CM Mohan Charan Majhi to attend bilateral programme
On November 11, members of the Japanese business delegation will visit the Indo-Nissin facility at the Khordha Food Processing Park to gain insights into the operations of the Japanese company in Odisha.
The delegation will subsequently participate in the official bilateral programme with Chief Minister Mohan Charan Majhi at the State Convention Centre.
The proposed Friendship Agreement between Odisha and Tottori Prefecture is expected to be a key outcome of the engagement, laying the foundation for sustained cooperation between the two regions.
Skill development and technical education on agenda
Strengthening cooperation in skill development and technical education will also feature prominently during the visit.
The Japanese delegation will tour the World Skill Centre in Bhubaneswar and interact with students, faculty members and officials.
The discussions are expected to focus on technical training, industry-oriented skills and opportunities for international exposure for Odisha’s young workforce.
With Japan’s industrial expertise and Odisha’s growing focus on skill development, the proposed engagement could create opportunities for knowledge sharing, training partnerships and improved employability.
Odisha and Tottori to showcase cultural heritage
Beyond business and industrial cooperation, the visit will also focus on strengthening people-to-people connections.
A cultural programme at Kala Bhoomi in Bhubaneswar will showcase the rich traditions and cultural heritage of Odisha and Tottori Prefecture.
The initiative is expected to encourage cultural understanding and provide a platform for future exchanges involving students, youth and professionals from both regions.
On November 12, the delegation will visit the UNESCO World Heritage Site of Konark Sun Temple before concluding its three-day Odisha visit.
Odisha looks to translate partnership into investment opportunities
Ahead of the visit, Industries, Skill Development and Technical Education Minister Sampad Chandra Swain said Odisha and Japan shared a growing partnership built on mutual trust and common opportunities.
He described the Tottori Governor’s visit as an important opportunity to strengthen bilateral engagement and expand cooperation across multiple sectors.
The minister emphasised that the state’s priority was to translate discussions into sustainable partnerships and tangible benefits for people in both regions.
With industrial investment, technology collaboration, skill development and cultural exchanges forming the core of the agenda, the visit of the Japanese delegation could mark another significant step in strengthening Odisha’s international economic and diplomatic engagement.
6, Nov 2026
Quantinuum Reports Third Quarter 2026 Results and Raises Full-Year Revenue Outlook
- Third-Quarter Revenue Grew 233% Year-Over-Year; Raised FY2026 Revenue Outlook
- Extended Fault-Tolerance Industry Leadership with Back-to-Back World Records, Validating Most Credible Path to Universal, Fault-Tolerant Quantum Computing
- Announced Nexus Roadmap Through Apollo; Platform Adoption Grew Nearly 20% Quarter-Over-Quarter and Job Submissions Increased Tenfold Year-Over-Year for the 12 Months Ended August 2026
- Secured Largest Cloud Agreement in Company History, Including Multi-Year Committed Full-Stack Access Through Apollo
- Expanded Enterprise Reach Through Leading Hyperscaler Agreement and Oracle Beta Launch
BROOMFIELD, Colo., Nov. 5, 2026 /PRNewswire/ — Quantinuum Inc. (Nasdaq: QNT) (the “Company”), a leading full-stack quantum computing company, today announced financial results for the third quarter ended September 30, 2026.
“In the third-quarter, we extended our technology leadership in the critical area of fault-tolerance, added to our customer base, and expanded our routes to market,” said Rajeeb Hazra, President and Chief Executive Officer of Quantinuum. “This accelerated momentum is supporting our raised revenue outlook for 2026 and giving us more confidence than ever in the opportunity in front of us.”
Third Quarter 2026 Financial Highlights
- Revenue was $9.1 million, an increase of 233% year-over-year, compared with $2.7 million in the prior-year period.
- GAAP gross margin was 33.3%, compared with (43.5%) the prior-year period.
- Adjusted gross margin was 74.6%, up 853 basis points versus the prior-year period.
- Adjusted EBITDA loss was $80 million, compared with a loss of $45 million in the prior-year period.
- GAAP net loss was $118 million, compared with a net loss of $52 million in the prior-year period.
- GAAP net loss per share attributable to Class A common stockholders was $0.46.
- Adjusted net loss per share was $0.29.
- Cash & cash equivalents were $1.94 billion as of September 30, 2026.
Adjusted EBITDA, Adjusted Gross Margin and Adjusted net loss per share are non-GAAP financial measures defined under “Non-GAAP Financial Measures.” For a reconciliation of these non-GAAP financial measures to the most directly comparable GAAP financial measures, refer to the Appendix tables at the end of this press release.
Third Quarter and Recent Business Highlights
Commercial Highlights:
- Signed the largest cloud agreement in Company history, securing a multi-year extension with a leading global financial institution that includes committed access through Apollo and Nexus.
- Signed with another top 5 global pharmaceuticals company on applying quantum computing and AI to cancer-therapy materials that offer the potential to accelerate drug development and enable more effective treatments.
- Signed agreement with GE Vernova to advance application development in superconducting materials.
- Signed deal with Abu Dhabi Maritime Academy and Quincus for research and applications in maritime logistics.
- Expanded cloud distribution through a new agreement with a leading hyperscaler serving millions of developers and advanced Oracle partnership by launching a joint beta program for hybrid quantum-AI applications.
- Deepened U.S. government commitments by continuing to execute on DARPA QBI Stage B contract, actively discussing a Stage C scope of work, and participating in four winning proposals under Phase 1 of the Department of Energy’s Genesis Mission
- Advanced international deployments, with Helios assembly underway in Singapore ahead of spring 2027 commissioning and a Reimei system upgrade at RIKEN in Japan scheduled for completion this month.
Product Technology & Supply Chain:
- Validated the Company’s leading path to universal, fully fault-tolerant quantum computing by 2029 with back-to-back accuracy world records on Helios using two codes within the same scalable, end-to-end logical architecture. Reached 99.9995% logical fidelity in October—within Apollo’s target range—with an error rate ten times lower than September’s record and 100 times lower than the best published result across other hardware modalities. Results also demonstrate Quantinuum’s significant overhead and scalability advantage.
- Sol remains on track for 2H 2027, with full-scale control-system validation complete and integration and assembly targeted for Q1 2027, ahead of validation and tuning toward 100 logical qubits at a target logical error rate of 10⁻⁵.
- Apollo remains on track for 2029, supported by design milestones, including validating that our cryogenic system can be deployed at the required scale.
- Strengthened the manufacturing foundation for future systems through partnerships with GlobalFoundries, Infineon, Honeywell Aerospace and Monarch Quantum, and finalized the CHIPS R&D award as the only trapped-ion company selected.
Software:
- Announced a multi-generational Nexus roadmap through Apollo, aligning application development and hybrid deployment with successive hardware generations to build what the Company believes will be the first developer platform designed for the fault-tolerant era.
- Expanded fault-tolerant capabilities through a September Nexus release that extends Guppy tools for logical-qubit programming and supported error-correction encoding, reducing the need to rewrite applications for specific codes. Planned December release will expand responsive hybrid quantum-classical workflows, supported error-correction codes, and execution analytics for application optimization.
- Accelerated Nexus adoption and usage, with adoption growing nearly 20% quarter-over-quarter to 215 organizations; total job submissions increased tenfold in the 12 months through August 2026 compared with the preceding 12-month period.
Ecosystem:
- Introduced QUOPS with Sandia National Laboratories and NVIDIA, benchmarking useful computational scale and speed. Quantinuum is building industry-wide alignment toward a common standard that supports customer comparisons and purchasing decisions.
- Expanded the quantum user ecosystem, growing Q-Net to more than 800 members, adding eight startup partners and partnering with Singapore’s National Quantum Office to organize a global quantum challenge that attracted more than 200 submissions.
Financial Outlook
- Raising full-year 2026 revenue outlook to $31 to $34 million, up from $28 to $32 million previously.
Third Quarter 2026 Conference Call
Quantinuum will host a conference call at 5 PM Eastern time on Thursday, November 5, 2026, to discuss its results for the third quarter ended September 30, 2026, and provide a business update. The call will be available live via webcast here.
An archive replay of the webcast will be made available on the Quantinuum Investor Relations website following the call and will remain available for one year.
Non-GAAP Financial Measures
To supplement Quantinuum’s condensed consolidated financial statements presented in accordance with U.S. generally accepted accounting principles (“GAAP”), the Company uses the following non-GAAP financial measures presented in this release: Adjusted Gross Profit, Adjusted Gross Margin, Adjusted Net Loss, fully distributed, Adjusted EBITDA, and Adjusted Net Loss Per Share, fully distributed.
Adjusted Gross Profit starts with GAAP gross profit and adds back equity compensation and related employer taxes attributable to cost of revenue and depreciation and amortization attributable to cost of revenue.
Adjusted Gross Margin is calculated as Adjusted Gross Profit divided by revenue, net.
Adjusted Net Loss, fully distributed starts with GAAP net loss on an as-converted basis, adjusts for equity compensation and related employer taxes, costs of the initial public offering and the transition to public company reporting, severance expense, the change in fair value of liability-classified warrants, and loss on disposal and write down of assets, and then applies an assumed statutory tax rate to the resulting adjusted pre-tax loss. No tax benefit is recognized in respect of losses subject to a full valuation allowance, and accordingly no tax benefit is reflected in the periods presented.
Adjusted EBITDA starts with Adjusted Net Loss, fully distributed, and further excludes income tax expense, interest income, net, depreciation, and amortization of acquired intangibles.
Adjusted Net Loss Per Share, fully distributed is calculated as Adjusted Net Loss, fully distributed, divided by adjusted shares, fully distributed, basic and diluted, comprising weighted-average Class A common shares outstanding and Common Units of Quantinuum Holdings.
Management believes these measures provide investors with additional information useful in evaluating the Company’s operating performance and trends across periods. Quantinuum’s results include large non-cash charges that management does not consider indicative of ongoing operating performance, principally stock-based compensation recognized on completion of the Reorganization and remeasurement of liability-classified warrants. Both are driven by accounting triggers and external inputs rather than operating activity. As an early commercial-stage business, Quantinuum’s period-to-period results also are affected by the timing of individual contracts. Measures that isolate underlying operating performance from non-cash and transition items help investors assess trends across periods.
Quantinuum’s Up-C structure means that GAAP net loss attributable to Quantinuum Inc. reflects only the Class A share of the economics. Presenting adjusted results on an as-converted, fully distributed basis describes the whole economic enterprise, which is how management assesses performance and how the business is managed. Management uses these measures for internal planning and forecasting, evaluating operating performance, and preparing budgets.
These non-GAAP financial measures are supplemental and are not prepared in accordance with GAAP. They are not intended to be considered in isolation or as a substitute for the most directly comparable financial information prepared in accordance with GAAP. Quantinuum’s non-GAAP measures may differ from similarly titled measures used by other companies and, therefore, may not be comparable. Investors should review the reconciliations and should not rely on any single financial measure to evaluate the Company’s business.
Each non-GAAP financial measure is reconciled to its most directly comparable GAAP financial measure in the tables at the end of this release.
About Quantinuum
Quantinuum is a leading quantum computing company offering a full-stack platform designed to make quantum computing deployable in real-world environments. The company has commercially deployed multiple generations of trapped-ion based quantum systems built on the well-established QCCD architecture, which it has implemented with novel designs and capabilities to achieve the industry’s highest accuracy levels based on average two-qubit gate fidelity. Quantinuum has active engagements with market leaders across pharmaceuticals, material science, financial services, and government and industrial markets, as well as academic and research institutions globally.
The company has a global workforce of approximately over 850 employees, including top scientists and researchers. Over 70% of its technology team holds PhDs or Master’s degrees. Quantinuum’s headquarters is in Broomfield, Colorado, with additional facilities across the United States, United Kingdom, Germany, Japan, Qatar, and Singapore.
Availability of Information on Quantinuum’s Website
Investors and others should note that Quantinuum routinely announces material information to investors and the marketplace using SEC filings, press releases, public conference calls, webcasts, and the Quantinuum Investor Relations website. While not all of the information that the Company posts to the Quantinuum Investor Relations website is of a material nature, some information could be deemed to be material. Accordingly, the Company encourages investors, the media, and others interested in Quantinuum to review the information that it shares on ir.quantinuum.com.
Forward-Looking Statements
This press release contains forward-looking statements within the meaning of the Private Securities Litigation Reform Act of 1995. These statements are based on the current beliefs and expectations of Quantinuum’s management and are subject to significant risks and uncertainties. Actual results may differ materially from those described in the forward-looking statements. Any statements made in this press release that are not statements of historical fact, including statements about our beliefs, expectations and outlook are forward-looking statements. Forward-looking statements include information concerning possible or assumed future results of operations, including our guidance and descriptions of our business plans and strategies. These statements often include words such as “anticipate,” “expect,” “guidance,” “suggest,” “plan,” “believe,” “intend,” “estimate,” “target,” “project,” “should,” “could,” “would,” “may,” “will,” “forecast,” “outlook,” “potential,” “continues,” “seeks,” “predicts,” or the negatives of these words and other similar expressions.
Factors that could cause actual results to differ materially from those described in forward-looking statements include, but are not limited to: our ability to develop, commercialize and achieve market acceptance of our quantum computing hardware and software products; the pace of development of the quantum computing industry and the timing of commercial quantum advantage; our ability to attract and retain customers for our quantum computing systems and quantum computing as a service offerings; the risk of technological obsolescence or the emergence of competing quantum computing approaches, including superconducting, photonic, or other modalities; our dependence on key suppliers and manufacturers of specialized components, including those necessary for our trapped-ion quantum systems; our ability to scale production of our quantum computers and related systems; our ability to protect our intellectual property and proprietary technology; the significant research and development costs inherent in developing next-generation quantum computing capabilities; our ability to attract and retain highly skilled scientists, engineers and other personnel in a competitive labor market; changes in government funding, export controls, or regulations affecting quantum technologies; uncertainty regarding the timing and extent of commercial applications; cybersecurity risks and the protection of sensitive customer data; and macroeconomic conditions, geopolitical instability and their potential effects on our business and operations. For additional information on these and other risks that could affect the Company’s forward-looking statements, see the Company’s risk factors discussed in its filings with the U.S. Securities and Exchange Commission, including its most recent Quarterly Report on Form 10-Q, as such risk factors may be updated from time to time. You should evaluate all forward-looking statements made in this press release in the context of these risks and uncertainties. The Company disclaims any intent or obligation to update, revise or withdraw any forward-looking statement in this press release, except as required by applicable law or regulation.
Contacts
Investor & Media Contact
Shub Mukherjee – Investor Contact – investors@quantinuum.com
Aaron Sorenson – Media Contact – press@quantinuum.com
Appendix
|
Condensed Consolidated Statements of Operations (Unaudited) |
|||||
|
(dollars in thousands, except share and per share data) |
|||||
|
Amounts may not sum due to rounding. |
Three Months Ended September 30, |
Nine Months Ended September 30, |
|||
|
2026 |
2025 |
2026 |
2025 |
||
|
Revenue—net |
9,050 |
2,715 |
22,285 |
23,908 |
|
|
Costs and expenses: |
|||||
|
Cost of revenue |
3,194 |
1,058 |
14,618 |
3,728 |
|
|
Amortization expense |
4,184 |
2,839 |
12,554 |
8,517 |
|
|
Research and development expenses—net |
97,482 |
42,382 |
519,433 |
117,822 |
|
|
Sales and marketing expenses |
14,856 |
3,977 |
57,920 |
10,779 |
|
|
General and administrative expenses |
22,149 |
5,334 |
182,752 |
16,903 |
|
|
Total costs and expenses |
141,865 |
55,590 |
787,277 |
157,749 |
|
|
Loss from operations |
(132,815) |
(52,875) |
(764,992) |
(133,841) |
|
|
Interest income—net |
(14,324) |
(3,072) |
(23,807) |
(5,415) |
|
|
Loss on change in fair value of warrant |
— |
2,100 |
111,815 |
9,900 |
|
|
Other (income)/expense—net |
(283) |
3 |
(2,296) |
803 |
|
|
Loss before taxes |
(118,208) |
(51,906) |
(850,704) |
(139,129) |
|
|
Tax (benefit)/expense |
(357) |
130 |
260 |
313 |
|
|
Net loss |
(117,851) |
(52,036) |
(850,964) |
(139,442) |
|
|
Less: Net loss attributable to Quantinuum |
— |
N/A |
(246,680) |
N/A |
|
|
Less: Net loss attributable to the non- |
(100,899) |
N/A |
(521,914) |
N/A |
|
|
Net loss attributable to Quantinuum Inc. |
(16,952) |
N/A |
(82,370) |
N/A |
|
|
Net loss per share attributable to Class A |
(0.46) |
N/A |
(2.27) |
N/A |
|
|
Weighted-average shares used in computing net |
36,806,913 |
N/A |
36,216,440 |
N/A |
|
|
(1) For the nine months ended September 30, 2026, net loss per share of Class A common stock and weighted-average shares of Class A common stock are presented for the period during the Transactions through September 30, 2026, which is the period effective with and following the Transactions as defined in Note 1 — Description of Organization found in the June 30, 2026 form 10-Q. |
|||||
|
Condensed Consolidated Balance Sheets (Unaudited) |
||
|
(dollars in thousands) |
||
|
September 30, 2026 |
December 31, 2025 |
|
|
Assets |
||
|
Current assets: |
||
|
Cash and cash equivalents |
1,936,114 |
762,642 |
|
Accounts receivable |
3,254 |
5,068 |
|
Due from related parties |
336 |
604 |
|
Inventories |
8,057 |
— |
|
Net investment in lease, current |
5,773 |
5,773 |
|
Other current assets |
39,894 |
27,754 |
|
Total current assets |
1,993,428 |
801,841 |
|
Property and equipment—net |
162,598 |
120,965 |
|
Right-of-use assets |
30,171 |
10,000 |
|
Goodwill |
771,506 |
784,822 |
|
Other intangible assets—net |
101,027 |
114,282 |
|
Net investment in lease, non-current |
5,773 |
10,102 |
|
Other assets—net |
20,373 |
3,613 |
|
Total assets |
3,084,876 |
1,845,625 |
|
Liabilities |
||
|
Current liabilities: |
||
|
Accounts payable |
19,478 |
10,620 |
|
Due to related parties |
— |
1,273 |
|
Accrued liabilities |
60,475 |
44,358 |
|
Total current liabilities |
79,953 |
56,251 |
|
Warrant liability |
— |
38,400 |
|
License payable, non-current portion |
55,345 |
55,345 |
|
Operating lease liabilities, non-current |
29,137 |
7,143 |
|
Other liabilities |
605 |
893 |
|
Temporary equity |
||
|
Series A convertible redeemable preferred stock, $0.0001 par value per share; 31,983,034 |
— |
288,129 |
|
Series A-1 convertible redeemable preferred stock, $0.0001 par value per share; 28,016,966 |
— |
400,978 |
|
Series B convertible redeemable preferred stock, $0.0001 par value per share; 31,753,266 |
— |
824,834 |
|
Shareholders’ equity / Quantinuum (Cayman) equity |
||
|
Quantinuum (Cayman) equity |
— |
173,652 |
|
Preferred stock, $0.0001 par value per share; 20,000,000 shares authorized, as of September |
— |
— |
|
Class A common stock, $0.0001 par value per share; 2,000,000,000 shares authorized as of September |
4 |
— |
|
Class B common stock, $0.0001 par value per share; 2,000,000,000 shares authorized as of |
22 |
— |
|
Class A common stock held in treasury, at cost; 72,863 shares and 0 shares as of September |
(3,803) |
— |
|
Additional paid-in-capital |
541,704 |
— |
|
Accumulated other comprehensive (loss) income |
(1,466) |
— |
|
Accumulated deficit |
(82,370) |
— |
|
Total equity attributable to Quantinuum Inc. / Quantinuum (Cayman) |
454,091 |
173,652 |
|
Non-controlling interest |
2,465,745 |
— |
|
Total equity |
2,919,836 |
173,652 |
|
Total Liabilities and equity |
3,084,876 |
1,845,625 |
|
Condensed Consolidated Statements of Cash Flows (Unaudited) |
||
|
(dollars in thousands) |
||
|
Amounts may not sum due to rounding. |
Nine Months Ended September 30, |
|
|
2026 |
2025 |
|
|
Cash flows from operating activities: |
||
|
Net loss |
(850,964) |
(139,442) |
|
Adjustments to reconcile to net cash used for operating activities |
||
|
Depreciation and amortization |
27,868 |
22,442 |
|
Noncash lease expense |
4,510 |
1,799 |
|
Sales under sales-type lease |
— |
(16,526) |
|
Stock compensation expense |
484,699 |
— |
|
Loss on change in fair value of warrant liabilities |
111,815 |
9,900 |
|
(Gain)/Loss on disposal and write down of assets |
(4) |
909 |
|
Interest expense |
5 |
6 |
|
Foreign exchange (gain)/loss—net |
(118) |
(8) |
|
Access to quantum computing hardware |
6,889 |
4,746 |
|
Changes in operating assets and liabilities |
||
|
Accounts receivable |
1,804 |
1,769 |
|
Due from related parties |
224 |
424 |
|
Other current assets |
(20,836) |
(1,064) |
|
Net investment in leases |
4,330 |
4,330 |
|
Other assets—net |
(16,100) |
926 |
|
Accounts payable |
4,864 |
5,718 |
|
Due to related parties |
(1,126) |
76 |
|
Accrued liabilities |
12,481 |
7,052 |
|
Other liabilities |
(253) |
84 |
|
Net cash used for operating activities |
(229,912) |
(96,859) |
|
Cash flows from investing activities: |
||
|
Capital expenditures |
(64,705) |
(61,021) |
|
Net cash used for investing activities |
(64,705) |
(61,021) |
|
Cash flows from financing activities: |
||
|
Proceeds from the issuance of preferred stock to Honeywell |
— |
350,000 |
|
Proceeds from issuance of Series B Convertible Preferred Stock, net of issuance costs |
— |
251,103 |
|
Proceeds from issuance of common stock |
1,628,774 |
— |
|
Common stock issuance costs |
(28,844) |
— |
|
Other issuance Costs |
(814) |
|
|
Withholding taxes paid on stock compensation |
(130,780) |
— |
|
Net cash provided by financing activities |
1,468,336 |
601,103 |
|
Effect of exchange rate changes on cash and cash equivalents |
(247) |
1,589 |
|
Net increase in cash and cash equivalents |
1,173,472 |
444,812 |
|
Cash and cash equivalents at beginning of period |
762,642 |
172,343 |
|
Cash and cash equivalents at end of period |
1,936,114 |
617,155 |
|
Non-cash investing and financing activities: |
||
|
Unpaid purchases of property and equipment |
9,094 |
3,913 |
|
Unpaid other issuance costs |
1,774 |
7,263 |
|
Value of shares issued via cashless warrant exercise |
150,215 |
— |
|
Reconciliation of GAAP Gross Profit to Adjusted Gross Profit (Unaudited) |
|||||||
|
(dollars in thousands, except percentages) |
|||||||
|
Amounts may not sum due to rounding. |
Three Months Ended September 30, |
Nine Months Ended September 30, |
|||||
|
2026 |
2025 |
2026 |
2025 |
||||
|
Revenue, net |
9,050 |
2,715 |
22,285 |
23,908 |
|||
|
Cost of revenue |
3,194 |
1,058 |
14,618 |
3,728 |
|||
|
Amortization of acquired intangibles, cost of revenue portion¹ |
2,839 |
2,839 |
8,518 |
8,517 |
|||
|
GAAP gross profit |
3,017 |
(1,182) |
(851) |
11,663 |
|||
|
GAAP gross margin |
33.3 % |
(43.5 %) |
(3.8 %) |
48.8 % |
|||
|
Equity compensation and related employer taxes² |
748 |
— |
7,321 |
— |
|||
|
Depreciation and amortization³ |
2,985 |
2,975 |
10,024 |
9,553 |
|||
|
Adjusted gross profit |
6,750 |
1,793 |
16,494 |
21,216 |
|||
|
Adjusted gross margin |
74.6 % |
66.1 % |
74.0 % |
88.7 % |
|||
|
(1) Our condensed consolidated statements of operations present amortization of acquired intangibles as a single separate line and do not present a gross profit subtotal. The amount shown in this table is the portion of that line attributable to cost of revenue, allocated according to the assets to which it relates. Cost of revenue is presented as reported. The remaining portion is presented within research and development. (2) Represents stock-based compensation expense and the related employer payroll taxes on equity vesting, in each case attributable to cost of revenue. Employer payroll taxes were 2 and 244 for the three and nine months ended September 30, 2026, respectively, and 0 in the corresponding prior year periods. These amounts are a subset of the equity compensation and related employer taxes adjustment presented in the reconciliation of GAAP net loss. (3) Represents depreciation of property and equipment and amortization of acquired intangible assets attributable to cost of revenue. |
|||||||
|
Reconciliation of GAAP Net Loss to Adjusted Net Loss, Adjusted EBITDA and Adjusted Earnings Per Share (Unaudited) |
||||
|
(dollars in thousands, except share and per share amounts) |
||||
|
Amounts may not sum due to rounding. |
Three Months Ended September 30, |
Nine Months Ended September 30, |
||
|
2026 |
2025 |
2026 |
2025 |
|
|
Numerator |
||||
|
Net loss attributable to Quantinuum Inc. |
(16,952) |
N/A |
(82,370) |
N/A |
|
Net loss attributable to Quantinuum (Cayman) prior to the Transactions |
— |
N/A |
(246,680) |
N/A |
|
Net loss attributable to the non-controlling interest |
(100,899) |
N/A |
(521,914) |
N/A |
|
GAAP net loss, as-converted¹ |
(117,851) |
(52,036) |
(850,964) |
(139,442) |
|
Equity compensation and related employer taxes² |
37,333 |
— |
501,920 |
— |
|
IPO and public company readiness, legal and other transaction costs³ |
4,937 |
— |
24,738 |
— |
|
Severance expense |
353 |
— |
353 |
— |
|
Warrant fair value adjustment⁴ |
— |
2,100 |
111,815 |
9,900 |
|
Loss on disposal and write down of assets |
6 |
8 |
(4) |
909 |
|
Adjusted net loss, fully distributed |
(75,222) |
(49,928) |
(212,142) |
(128,633) |
|
Income tax (benefit) expense |
(357) |
130 |
260 |
313 |
|
Interest income, net |
(14,324) |
(3,072) |
(23,807) |
(5,415) |
|
Depreciation and other⁵ |
5,224 |
4,751 |
15,314 |
13,925 |
|
Amortization of acquired intangibles⁶ |
4,184 |
2,839 |
12,554 |
8,517 |
|
Adjusted EBITDA |
(80,495) |
(45,280) |
(207,821) |
(111,293) |
|
Denominator⁷ |
||||
|
Weighted-average Class A common shares outstanding, basic and diluted |
36,806,913 |
N/A |
36,216,440 |
N/A |
|
Common Units of Quantinuum Holdings |
225,242,666 |
N/A |
226,892,141 |
N/A |
|
Adjusted shares, fully distributed, basic and diluted |
262,049,579 |
N/A |
263,108,581 |
N/A |
|
Per share⁸ |
||||
|
GAAP net loss per Class A common share, basic and diluted |
(0.46) |
N/A |
(2.27) |
N/A |
|
Adjusted net loss per share, fully distributed, basic and diluted |
(0.29) |
n.m. |
(0.81) |
n.m. |
|
(1) The as-converted basis includes the economic interests represented by Class A common stock and Common Units of Quantinuum Holdings as if all Common Units were exchanged for Class A common stock. It is used because Class A common stock represents a minority of the economic interest in Quantinuum Holdings. (2) Represents non-cash compensation expense associated with equity-based awards, including expense recognized in connection with the Reorganization, together with the related employer payroll taxes on equity vesting. Employer payroll taxes were $94 and $17,221 for the three and nine months ended September 30, 2026, respectively, and zero in the corresponding prior year periods. The stock-based compensation component agrees to the stock compensation expense line in the condensed consolidated statements of cash flows. (3) Represents costs of the initial public offering, transaction costs, and the transition to public company reporting. These costs represent professional fees for advisory, legal, accounting, valuation and other professional or consulting services incurred related to the IPO. These costs are scoped by reference to their cause and have a defined end. They do not include the ongoing costs of operating as a public company. (4) Represents the non-cash change in fair value of liability-classified warrants, which is driven by valuation inputs and accounting remeasurement rather than operating activity. (5) Represents total depreciation and amortization per our condensed consolidated statements of cash flows, less amortization of acquired intangibles shown separately below. Includes amortization of capitalized software. (6) Represents total amortization of acquired intangible assets for the period and agrees to the amortization expense line in the condensed consolidated statements of operations. (7) The denominator comprises Class A common stock and all Common Units of Quantinuum Holdings. Class B common stock is non-economic, carries voting rights only, and is cancelled upon exchange of the corresponding Common Units. (8) GAAP net loss per Class A common share covers only the period from June 5, 2026, following the Transactions, while adjusted net loss per share, fully distributed, covers the full nine month period presented. The two measures therefore are not calculated on the same period basis. No per share amounts are presented for periods prior to the Reorganization because the calculation would not produce values meaningful to users.
|
||||
View original content to download multimedia:https://www.prnewswire.co.uk/news-releases/quantinuum-reports-third-quarter-2026-results-and-raises-full-year-revenue-outlook-302931318.html
6, Nov 2026
Chinese and foreign cultural & media figures visited China Auto Valley
BEIJING, Nov. 5, 2026 /PRNewswire/ — From September 9 to 11, 2026, the event “Smart Manufacturing Stories, Global Voices — China Auto Valley Tour for Chinese and Foreign Cultural & Media Figures” was held in the Wuhan Economic & Technological Development Zone, Hubei Province. The event was co-organized by the CICG Academy of Translation and Interpretation and the Publicity Department of the Working Committee of the Wuhan Economic & Technological Development Zone.
Translators, writers, and media journalists from China, the United Kingdom, Egypt, Pakistan, Morocco, Russia gathered in Wuhan. They visited the Dongfeng Motor Global Innovation Center, M-Hero vehicles, the Geely Lotus Global Smart Factory, and the China Auto Valley Exhibition Center, learning about autonomous driving technology, experiencing the smart manufacturing capabilities of China Auto Valley up close, and gaining a firsthand understanding of the automotive industry’s iterative upgrading, the clustering of science and technology industries, and urban renewal and transformation.
The visitors unanimously agreed that the Wuhan Economic & Technological Development Zone has made a major transition from traditional automobile manufacturing to smart and green manufacturing. Its comprehensive industrial-chain support and strong momentum for innovation vividly demonstrate the great strength of China’s smart manufacturing. Its model of coordinated industrial and urban development provides a practical reference for industrial cities worldwide.
 View original content to download multimedia:https://www.prnewswire.co.uk/news-releases/chinese-and-foreign-cultural–media-figures-visited-china-auto-valley-302930940.html

6, Nov 2026
Chinese and foreign cultural & media figures visited China Auto Valley
BEIJING, Nov. 5, 2026 /PRNewswire/ — From September 9 to 11, 2026, the event “Smart Manufacturing Stories, Global Voices — China Auto Valley Tour for Chinese and Foreign Cultural & Media Figures” was held in the Wuhan Economic & Technological Development Zone, Hubei Province. The event was co-organized by the CICG Academy of Translation and Interpretation and the Publicity Department of the Working Committee of the Wuhan Economic & Technological Development Zone.
Translators, writers, and media journalists from China, the United Kingdom, Egypt, Pakistan, Morocco, Russia gathered in Wuhan. They visited the Dongfeng Motor Global Innovation Center, M-Hero vehicles, the Geely Lotus Global Smart Factory, and the China Auto Valley Exhibition Center, learning about autonomous driving technology, experiencing the smart manufacturing capabilities of China Auto Valley up close, and gaining a firsthand understanding of the automotive industry’s iterative upgrading, the clustering of science and technology industries, and urban renewal and transformation.
The visitors unanimously agreed that the Wuhan Economic & Technological Development Zone has made a major transition from traditional automobile manufacturing to smart and green manufacturing. Its comprehensive industrial-chain support and strong momentum for innovation vividly demonstrate the great strength of China’s smart manufacturing. Its model of coordinated industrial and urban development provides a practical reference for industrial cities worldwide.
View original content to download multimedia:https://www.prnewswire.co.uk/news-releases/chinese-and-foreign-cultural–media-figures-visited-china-auto-valley-302930940.html